
Figure 2:
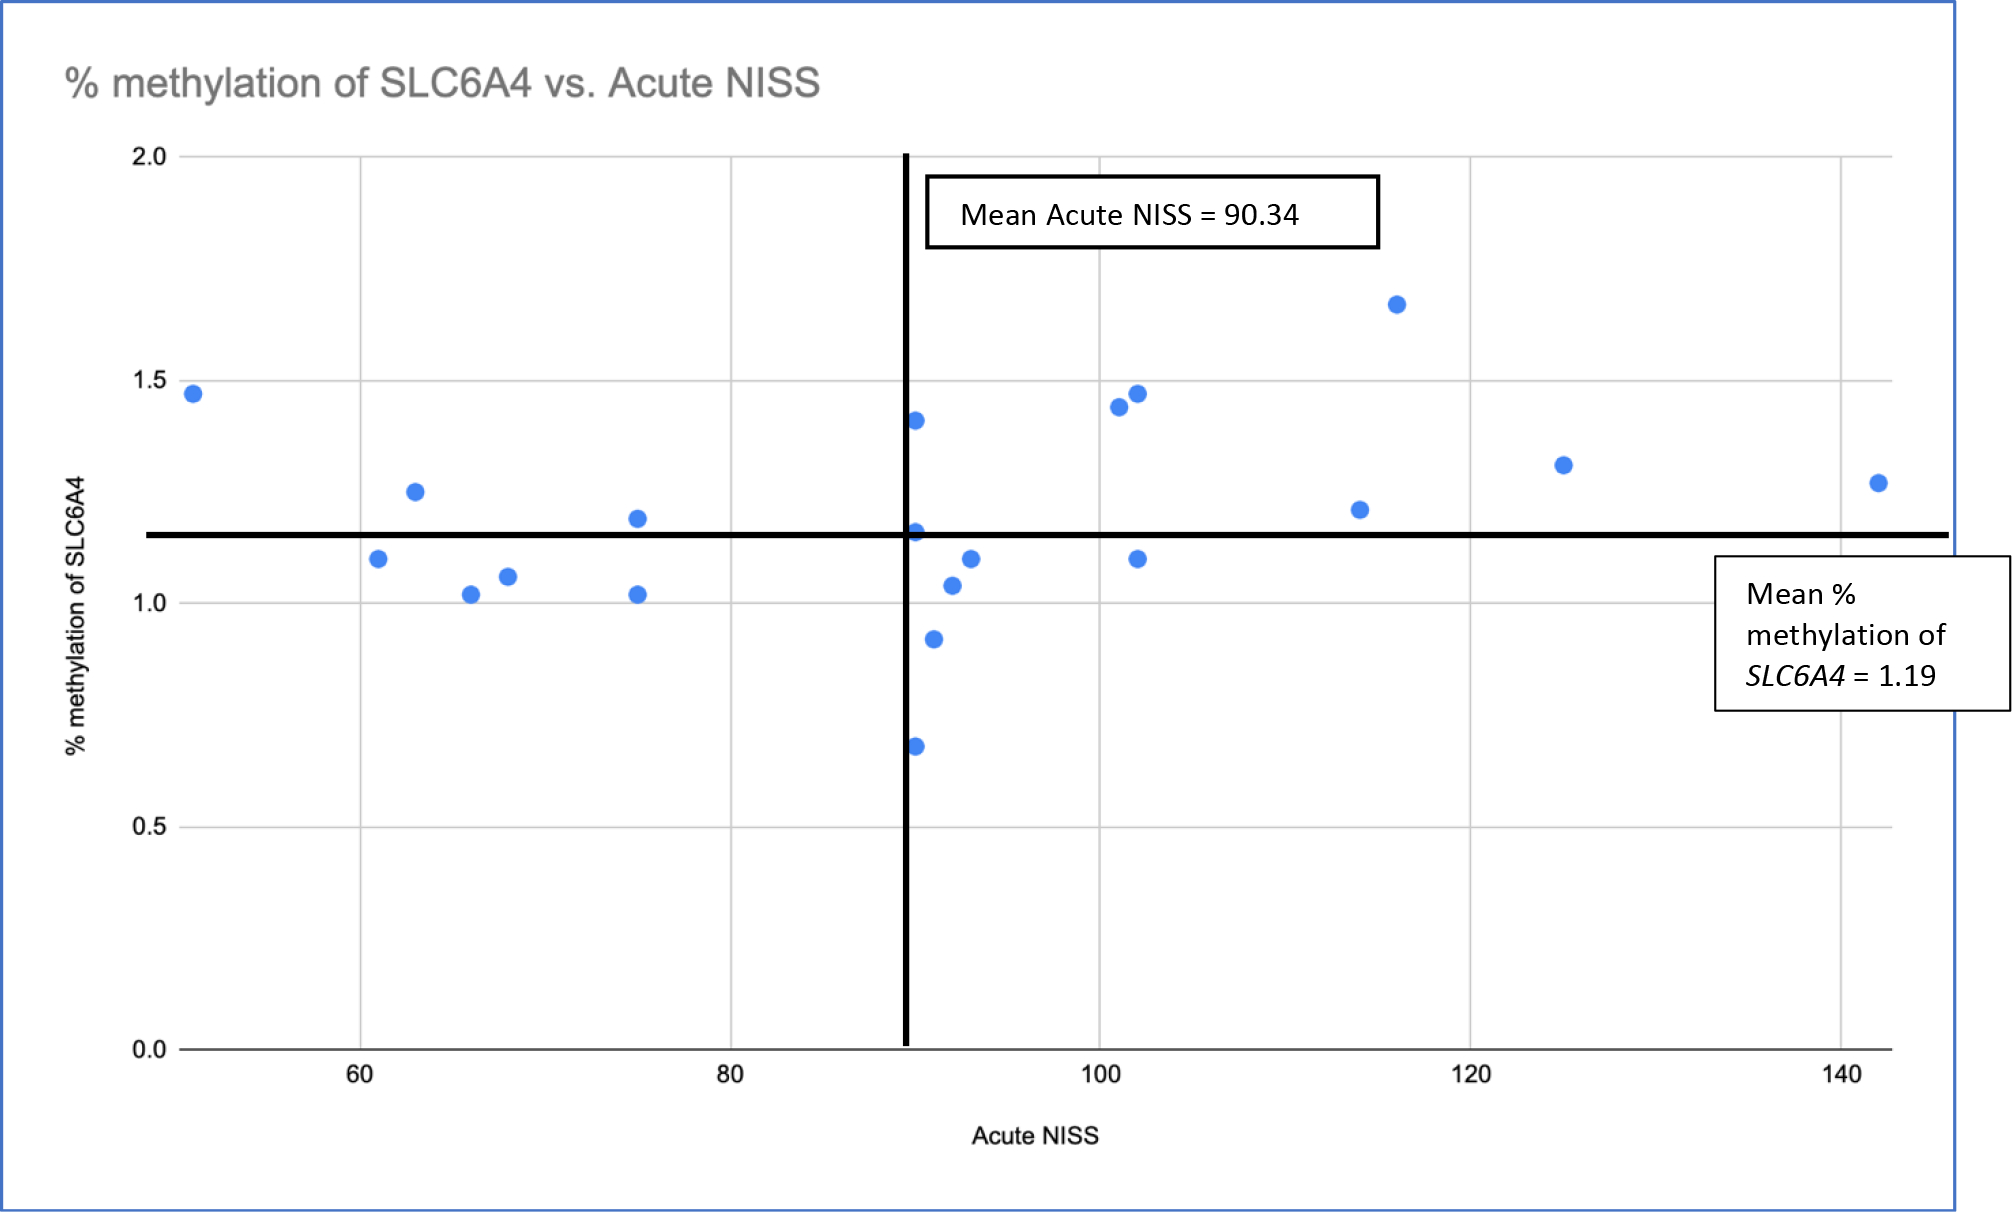
Scatter plot of infant percentage of DNAm of SLC6A4 in relationship to acute NISS score at the time of enrollment in the study.
Official websites use .gov
A
.gov website belongs to an official
government organization in the United States.
Secure .gov websites use HTTPS
A lock (
) or https:// means you've safely
connected to the .gov website. Share sensitive
information only on official, secure websites.
Scatter plot of infant percentage of DNAm of SLC6A4 in relationship to acute NISS score at the time of enrollment in the study.