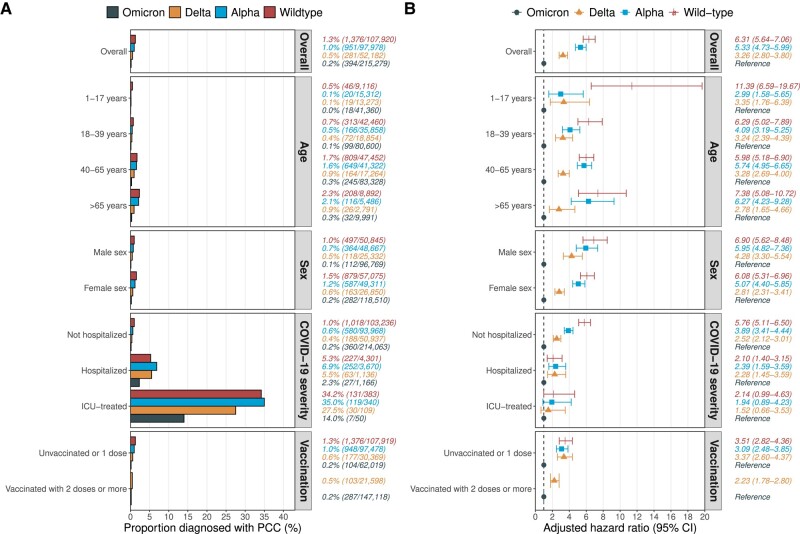
Figure 1.
Occurrence and hazard ratio of PCC diagnosis by SARS-CoV-2 variant of concern. A, The percentage diagnosed with PCC in the 4 variant cohorts overall as well as the 11 predefined subgroups. Numbers to the right represent the percentage diagnosed with PCC (number diagnosed with PCC / number in cohort). B, The adjusted hazard ratio (95% CI) for being diagnosed with PCC in the delta, alpha, and wild type cohorts as compared with the omicron cohort. These analyses were done for the overall cohorts as well as the 11 predefined subgroups. Numbers to the right represent the adjusted hazard ratio (95% CI). Models were adjusted for age (by using restricted cubic splines with 4 knots), sex, age × sex interaction, region of birth, education level, disposable income quartile, days with sickness benefit in 2019, and all studied comorbidities. For the subgroup analyses, the variable that defined the subgroup was excluded from the models (eg, age in the age subgroups). Education level, income, and sick days were excluded from the models in the subgroup analysis of individuals aged 1 to 17 years. For the subgroup analysis of vaccinated individuals, only those aged ≥18 years from the omicron and delta cohorts were included, since they had the possibility to receive ≥2 doses before the infection. ICU, intensive care unit; PCC, post–COVID-19 condition.

