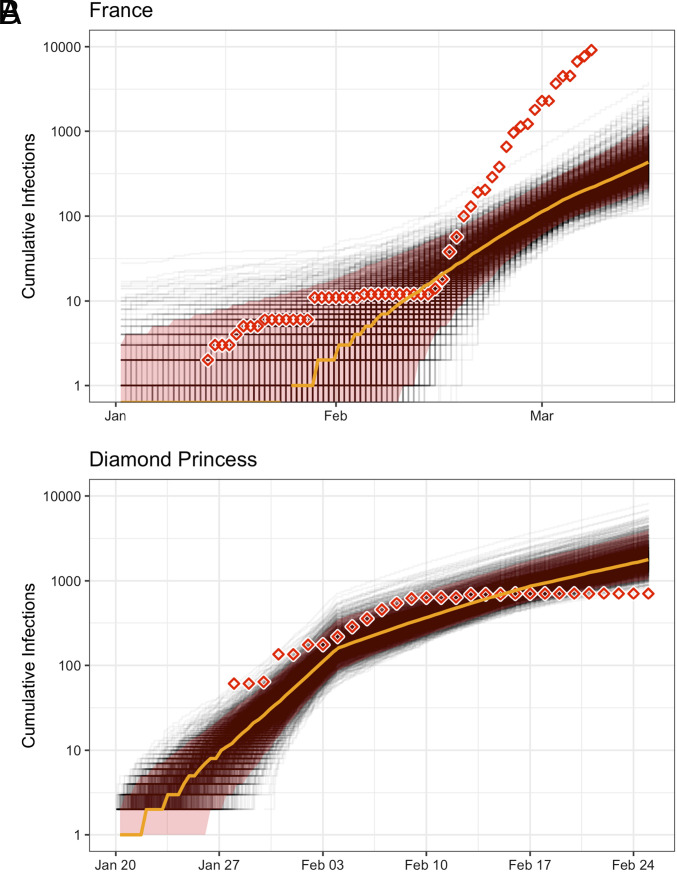
Fig. 2.
Inferred cumulative number of infections through time for (A) France, and (B) the Diamond Princess cruise ship. Gray lines indicate individual trajectories sampled from the posterior, the orange line indicates the posterior median, and the red shaded area indicates the 95% central posterior density interval for the number of infections at each point in time. Inferred numbers of infections are shown together with the corresponding confirmed case counts (diamonds) in each population as recorded by Dong et al. (30), which are offset by 10 d to account for the delay between infection and case confirmation (8). Note that these inferences concern only those infections associated with the specific outbreak from which the sequence data are drawn, as detailed in the discussion section. The total number of infections may have been much higher (Inference for remaining outbreaks are shown in SI Appendix, Fig. S11).

