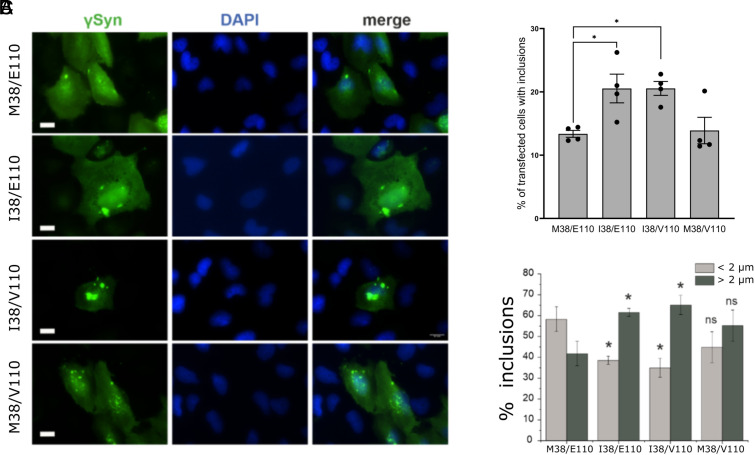
Fig. 4.
Inclusions formed by γSyn variants in human H4 cells. (A) Fluorescence microscope images of cultured cells 48 h after transfection with the respective expression plasmids. The cultured cells were immunostained with anti-γSyn antibody and nuclei counterstained with DAPI. (Scale bar, 20 µm.) (B) Quantification reveals an increase in the number of transfected cells that formed inclusions after expression of γSyn I38/E110 and I38/V110 variants, compared to expression of M38/E110 and M38/V110 variants. The bar chart shows mean ± SEM of percentage of successfully transfected cells bearing inclusions (*P < 0.05, one-way ANOVA, n = 4 independent experiments with >100 cells assessed in each experiment). (C) Analysis of inclusion size reveals that cells expressing γSyn I38/E110 or I38/V110 variants form larger inclusions more frequently than cells expressing the M38/E110 variant. The bar chart shows mean ± SD of percent of small (diameter <2 µm, light gray bars) and large (diameter >2 µm, dark gray bars) aggregates in transfected cells (*P < 0.05, Student's t test for independent variables).

