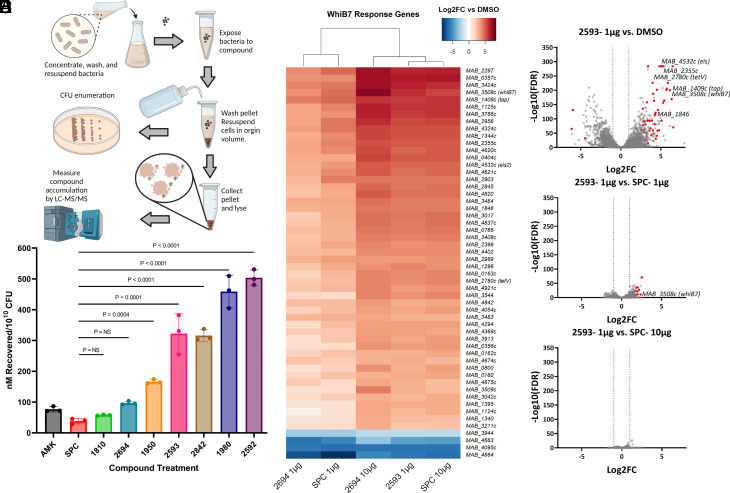
Fig. 2.
eAmSPCs accumulate intracellularly and induce similar transcriptomic response as SPC. (A) Workflow of whole-cell accumulation assay in Mab. (B) Intracellular accumulation of compounds against Mab upon 30-min exposure. Data shown are representative of three independent replicates (mean ± SD). (C) Heat map of whiB7 genes differentially expressed (Log2FC > |3|; FDR < 0.01) in at least one treatment group. (D–F) Volcano plots depicting differential gene expression analysis [Log2 Fold-Change vs. –Log10 (FDR)] of (D) 2593 (1 µg/mL) vs. dimethyl sulfoxide (DMSO), (E) 2593 (1 µg/mL) vs. SPC (1 µg/mL), and (F) 2593 (1 µg/mL) vs. SPC (10 µg/mL), where the circles on to the right side of the respective plots indicate an upregulation of genes for 2593. Red circles indicate whiB7 response genes identified in ref 7. Statistical significance for (B) using ANOVA determined groups were of equal variance by Brown–Forsythe test and Dunnet’s post test was then used compare results of experimental compounds to that of parent molecule, SPC. (C–F) Transcriptomic data shown are representative of three independent replicates. All concentrations listed are per mL. Abbreviations: AMK, amikacin; CFU, colony forming units; FC, fold-change; FDR, false discovery rate; SPC, spectinomycin.

