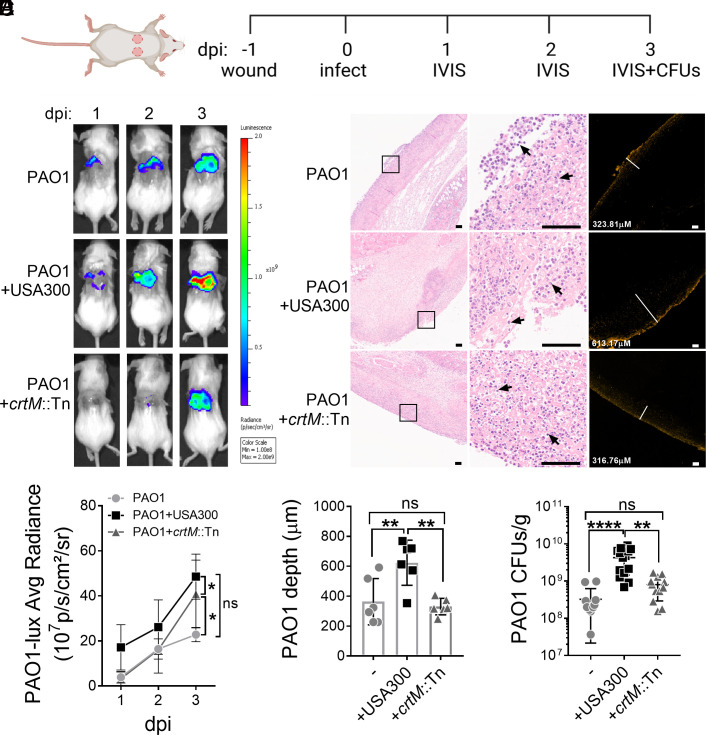
Fig. 4.
STX promotes the establishment of P. aeruginosa infection in vivo. (A) Schematic of the murine wound model and course of infection. Two identical full-thickness dorsal wounds were generated using 6 mm punch biopsies. After 24 h, the wounds were mono-infected with luminescent PAO1, USA300, or crtM::Tn, or co-infected with PAO1 and USA300 or crtM::Tn. On 1, 2, and 3 days post-infection (dpi), IVIS was used to monitor PAO1 burden among all groups. Wounds were harvested and homogenized to plate for both PAO1 and S. aureus CFUs on 3 dpi. (B) Representative images of luminescent PAO1 detected using IVIS on murine wounds throughout the 3 d of infection. (C) Representative images of H&E (Left and Middle panels) and IF (Right panel) stained adjacent wound sections (4 μm). The Left panel shows the wound beds in low magnifications. Magnified boxed areas are shown in the Middle panel, with black arrows pointing to neutrophil infiltration. The Right panel shows the presence of immunofluorescently labeled PAO1 and the white lines measure the depth of PAO1 penetration (labeled in the bottom left corner). (Scale bar: 100 μm.) (D) Luminescent signal intensity of PAO1-lux was quantified by the average radiance. Significant differences were determined by comparing the area under the curve (SI Appendix, Fig. S10A). Data presented as mean ± 95%CI from the results of >12 biological replicates. (E) The depth of PAO1 penetration into the wound with PAO1 mono-infection or co-infection with USA300 or crtM::Tn. Data are presented as mean ± 95%CI from the results of six biological replicates. (F) PAO1 CFUs per gram of wound tissue (CFUs/g) among all groups was quantified. Data are presented as mean ± 95%CI from the results of >12 biological replicates with three technical replicates. *P < 0.05; **P < 0.01; ****P < 0.0001; ns, not significant, determined by one-way ANOVA (D and E) or the Kruskal–Wallis test (F). S. aureus survival is quantified in SI Appendix, Fig. S10.

