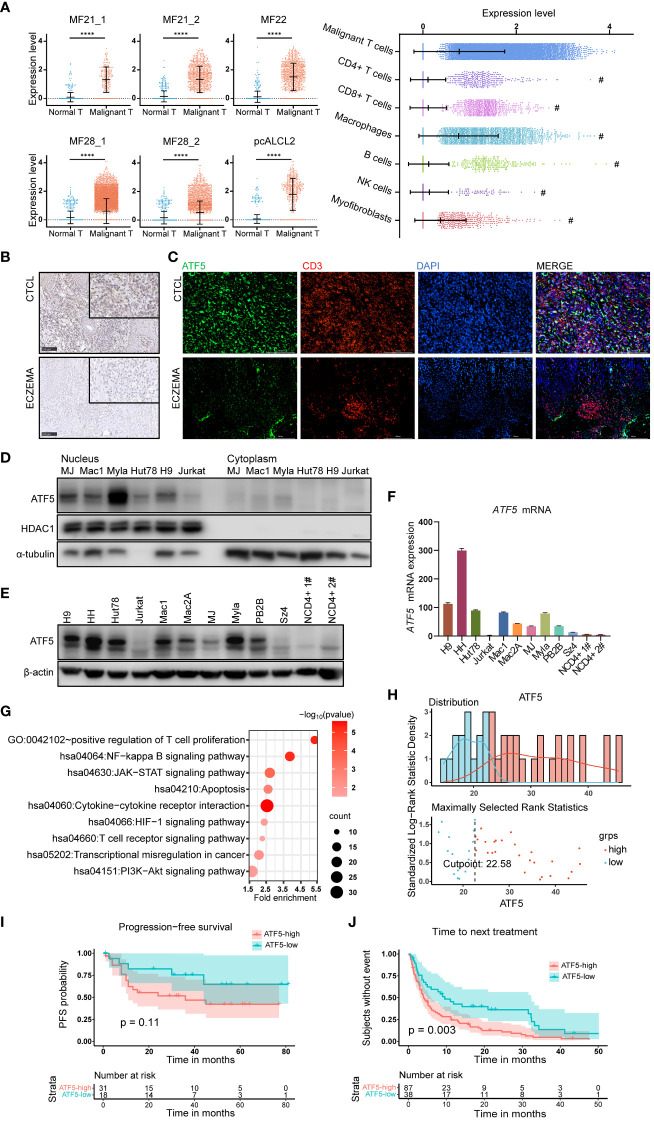
Figure 1.
ATF5 is highly expressed in cutaneous T cell lymphoma and associates with poor treatment response. (A) Normalized ATF5 expression in various cell types in 6 samples from 4 CTCL patients who have higher ATF5 expression in malignant T cells. Malignant T: malignant T cells, Normal T: normal T cells (B) Representative images of immunohistochemical staining of ATF5 in paraffin-embedded tissues from CTCL patients and eczema patients. Original magnification ×200, insets ×400, scale bar=50 μm. (C) Representative images of immunofluorescence costaining of ATF5 (green) and CD3 (red) in paraffin-embedded tissues from CTCL patients and eczema patients. DAPI (blue) was used to visualize cell nuclei. Original magnification ×200, scale bar=200 μm. (D) ATF5 protein expression in nuclear and cytoplasmic lysates of CTCL cell lines and Jurkat cells. (E, F) Expression levels of ATF5 protein (E) and mRNA (F) in 9 CTCL cell lines, Jurkat cells, and CD4+ T cells from 2 normal controls (NCD4+ 1#, NCD4+ 2#). ATF5 mRNA expression levels were normalized to GAPDH. (G) Annotated pathways from genes (n=873, p<0.05) positively correlated with ATF5 expression in our previously reported CTCL cohort with RNA sequencing (FDR<0.25, p<0.05). (H) ATF5 expression distribution and cut point for prognosis and treatment analysis in the CTCL cohort. A total of 49 patients with regular follow-up were recruited from March 2010 to December 2018. The median (range) follow-up duration was 32 (1–81) months. (I) Kaplan−Meier survival analysis of PFS (n=49 patients). Progression-free survival information was collected for each patient from the time of biopsy to the time of disease progression. (J) Kaplan−Meier survival analysis of TTNT (n=125 treatment episodes). Data are shown as mean ± SD and representative of at least three independent experiments. ****P<0.0001.

