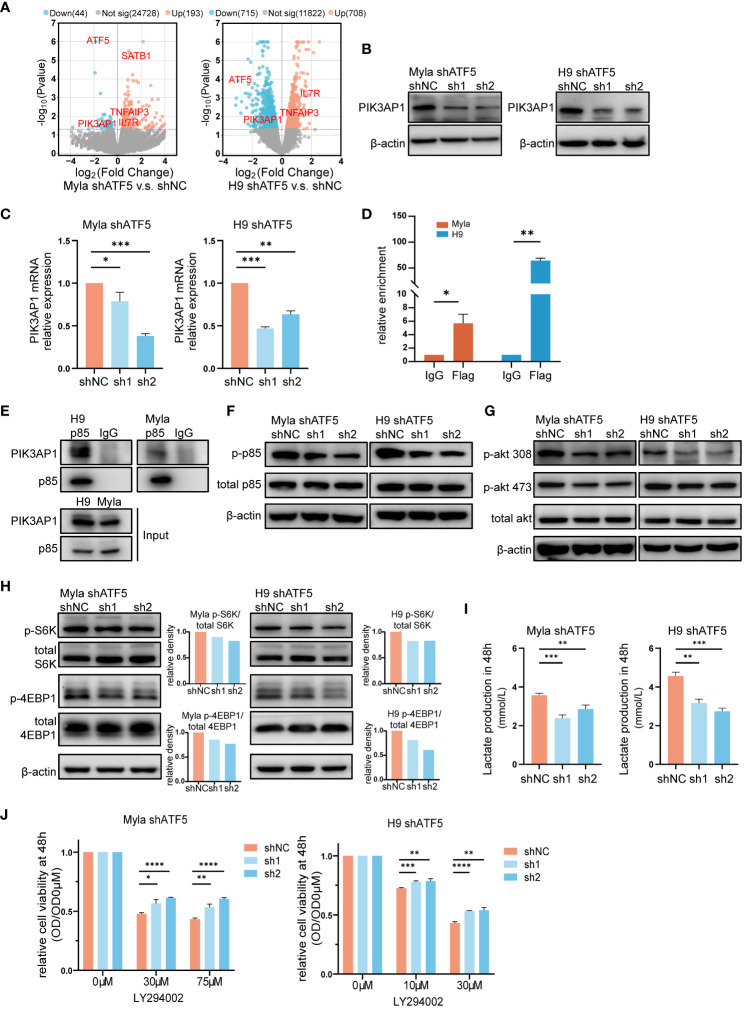
Figure 4.
The PI3K/AKT/mTOR pathway partially accounts for ATF5-promoted CTCL survival. (A) Volcano plot of upregulated (red) and downregulated (blue) DEGs (|fold change|>0 and P<0.05) between control (shNC) and ATF5-KD (shATF5) H9 and Myla cells. RNA was prepared 72 hours after transduction, following the validation of ATF5 knockdown. (B, C) Downregulation of PIK3AP1 protein (B) and mRNA (C) levels in control (shNC) and ATF5-KD (sh1, sh2) Myla and H9 cells. Relative PIK3AP1 mRNA expression was normalized to GAPDH and shNC. (D) Enrichment of ATF5 protein at the PIK3AP1 promoter in Myla and H9 cell lines stably expressing Flag-ATF5. (E) Immunoprecipitation in Myla and H9 cells using a p85 antibody or normal rabbit IgG with protein A/G agarose. PIK3AP1 and p85 were identified. (F-H) Phosphorylated p85, Akt, S6K and 4EBP1 in control (shNC) and ATF5-KD (sh1, sh2) Myla and H9 cells. The relative density of phosphorylated protein was normalized to total protein and control (shNC). Protein was prepared 72 hours after transduction, following the validation of ATF5 knockdown. (I) Lactate production at 48 h in control (shNC) and ATF5-KD (sh1, sh2) Myla and H9 cells. (J) Relative cell viability of control (shNC) and ATF5-KD (sh1, sh2) Myla and H9 cells after LY294002 treatment. Cell viability of the treated cells was normalized to that of the untreated cells at 48 h. Data are presented as mean ± SD and representative of at least three independent experiments. *P<0.05, **P<0.01, ***P<0.001, ****P<0.0001.

