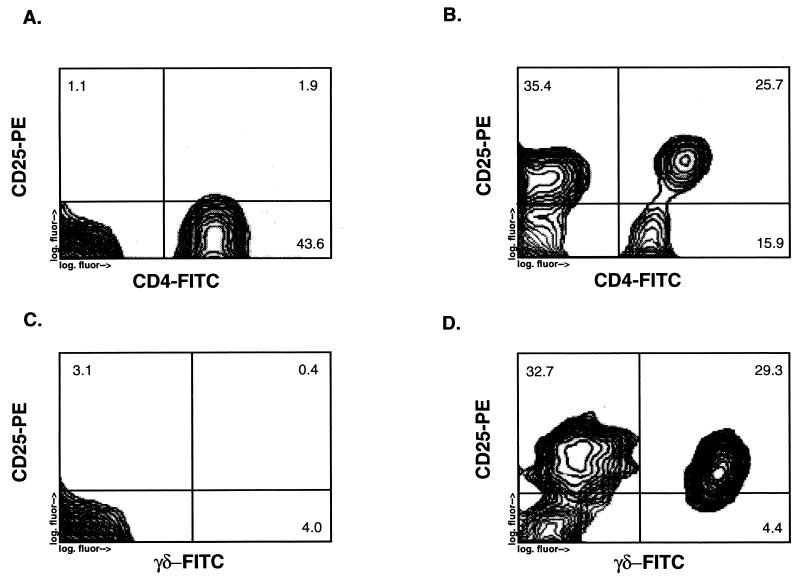
FIG. 1.
Upregulation of IL-2Rα (CD25) expression on peripheral blood CD4+ and γδ T cells by live M. tuberculosis. Shown are the results of an analysis by two-color flow cytometry of CD25 expression on CD4+ and γδ T cells from peripheral blood T cells stimulated for 7 days with either live M. tuberculosis (5 × 10⁶ bacilli per ml) (B and D) or no antigen (A and C). The y axis represents PE fluorescence for CD25, and the x axis represents FITC fluorescence for either CD4+ or γδ T cells.

