Fig 4.

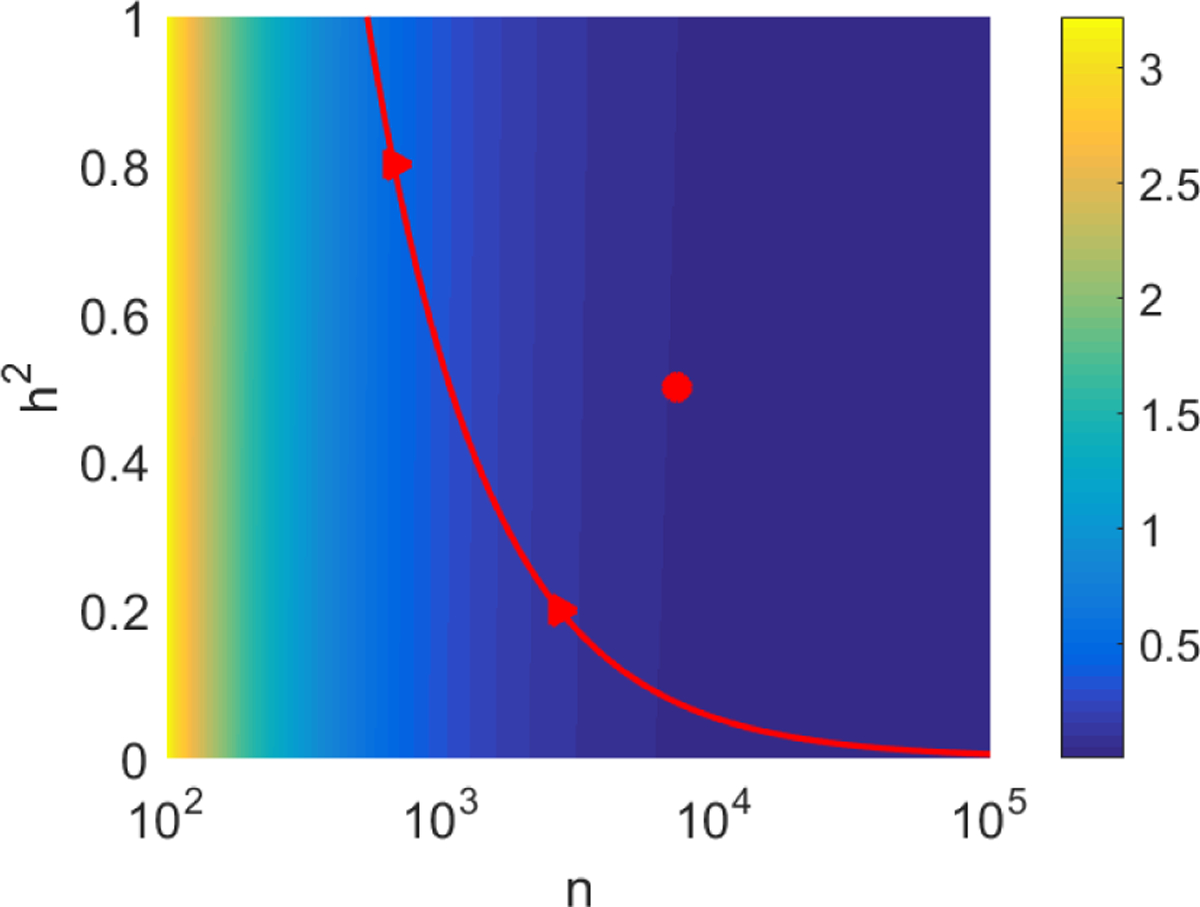
The SE of the GWASH estimator as a function of and , for and . The red curve indicates the pairs for which ; values of to the right of the curve allow detection of a non-zero SNP heritability at the level.

The SE of the GWASH estimator as a function of and , for and . The red curve indicates the pairs for which ; values of to the right of the curve allow detection of a non-zero SNP heritability at the level.