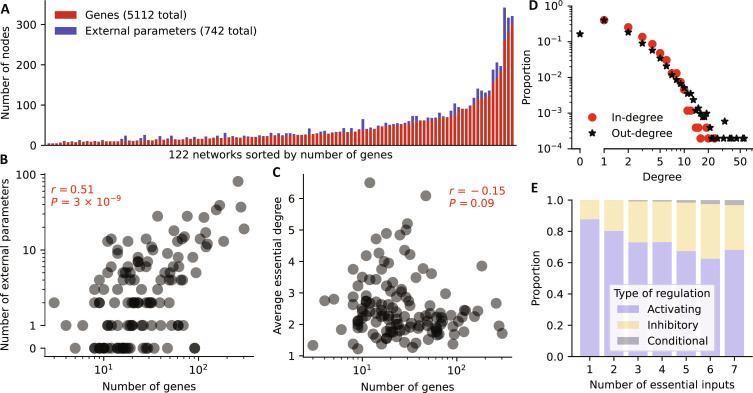
Fig. 1. Summary statistics of the analyzed GRN models.
(A) Plot of the number of genes and external parameters for each model sorted by number of genes. (B and C) For each model, the number of genes is plotted against (B) the number of external parameters and (C) the average essential in-degree of the genes. The Spearman correlation coefficient and associated P value are shown in red. (D) In-degree (red circles) and out-degree (black stars) distribution derived from all 5112 update rules. (E) Prevalence of each type of regulation (activation, blue; inhibition, orange; conditional, gray) stratified by the number of regulators (x axis). Nonessential regulations are excluded.

