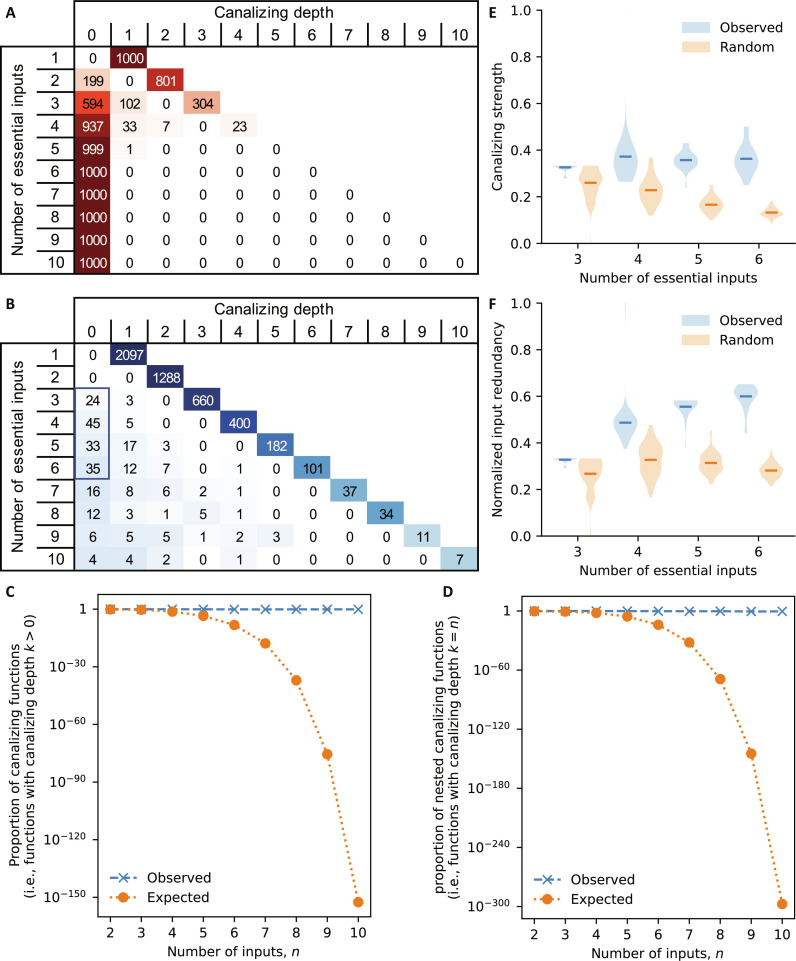
Fig. 2. High prevalence of canalization.
(A) Expected distribution of the canalizing depth for random Boolean functions for different numbers of essential inputs (1–10), based on 1000 random functions each. (B) Stratification of all identified update rules based on the number of essential inputs (rows) and the canalizing depth (columns). Update rules with more than 10 inputs were omitted here; table S1 contains the full analysis. The color gradient in (A) and (B) is computed separately for each row. (C and D) For Boolean functions with 2 to 10 (not necessarily essential) inputs, the proportion of (C) canalizing functions and (D) NCFs observed in published expert-curated GRN models (blue x) is compared to the expected proportion (orange dots), which is computed using explicit formulas for the number of canalizing and nested canalizing functions from (35). (E and F) The distribution of the (E) canalizing strength and (F) normalized input redundancy of all observed functions with three to six essential inputs and canalizing depth 0 [that is, all functions in the blue box in (B)] is shown (blue), as well as the expected distribution for random Boolean functions (orange), derived from 1000 samples each. Horizontal lines depict the respective mean values.

