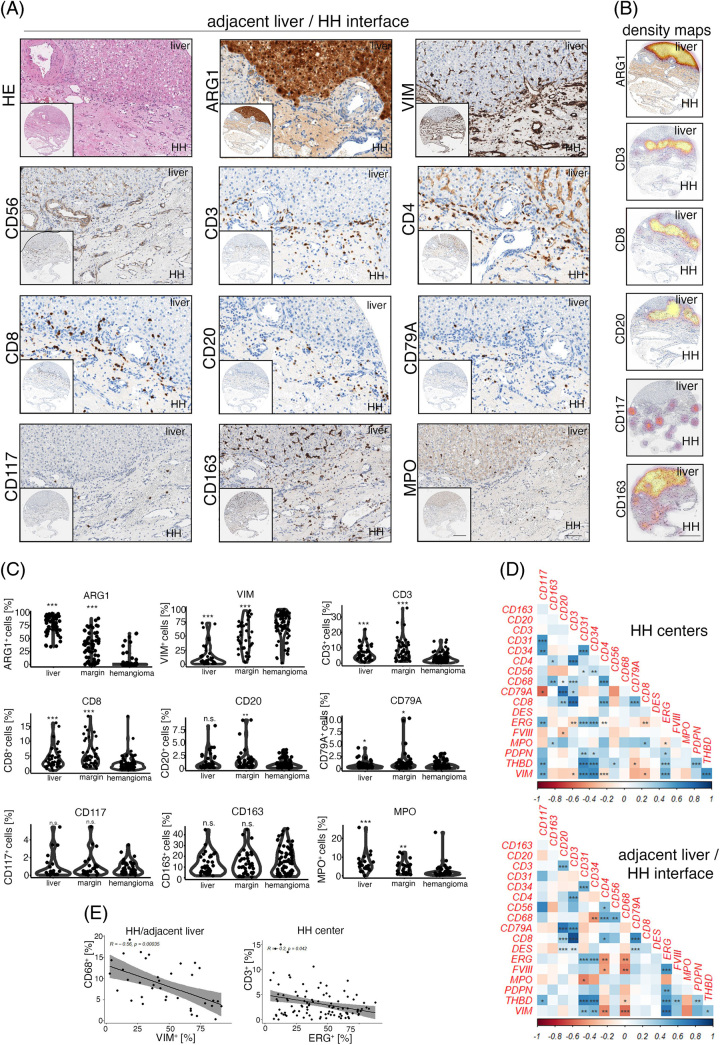
FIGURE 2.
mmunologic characterization of the human hepatic hemangioma/adjacent liver parenchyma interface. (A) Low and high magnification of HE, Arginase 1 (ARG1), Vimentin (VIM), CD56, CD3, CD4, CD8, CD20, CD79A, CD117, CD163 and Myeloperoxidase (MPO) in HH margins. Immune cell accumulation at the lesion/liver interface can be detected. Scale bar: 400 µm (low) and 100 µm (high). (B) Depiction of ARG1+, CD3+, CD8+, CD20+, CD117+ and CD163+ cell density overlay at the HH/adjacent liver parenchyma interface. ARG1 highlights hepatocytes, and CD3, CD8 and CD20 show the highest cell densities at the liver/lesion interface. Spatial cell distribution of CD117 and CD163 reveals high-density foci of marker-positive cells also within HH. Scale bar: 400 µm. (C) Percentual distribution of ARG1, VIM, CD3, CD8, CD20, CD79A, CD117, CD163 and MPO in distant liver tissues, HH/adjacent liver margins (margin), and HH centers (hemangioma). Wilcoxon rank-sum test of HH centers versus tissue area of interest (*p < 0.05, **p < 0.01, ***p < 0.001, n.s. = not significant). (D) Heatmaps displaying pairwise correlation metrics of marker-positive cells (%) in HH center and HH/adjacent liver parenchyma tissues. Spearman correlation coefficient displayed as a color code from 1 (blue) to −1 (red; *p < 0.05, **p < 0.01, ***p < 0.001). (E) Correlation analysis between CD68+/VIM+ and CD3+/ETS Transcription Factor ERG+ (ERG+) percentual numbers in adjacent liver/HH interface and HH center cores (Spearman correlation analysis). Abbreviations: HE, hematoxylin eosin; HH, hepatic hemangioma.

