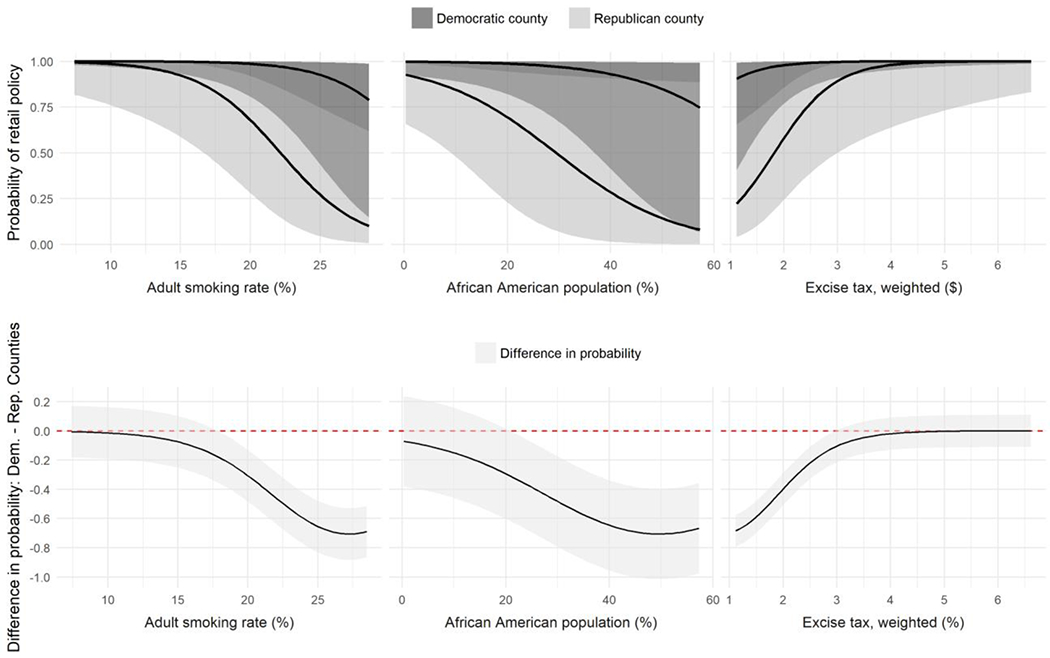
Figure 1:

The top row of graphs shows the probabilities of policy adoption across ranges of smoking rates, African American population and excise taxes. The bottom row shows the differences in predicted probability of policy adoption for each between Democrat and Republican counties. Shading indicates 95% confidence intervals.
