
Figure 2: Model comparison and validation of mNODE on synthetic data generated by the microbial consumer-resource model.
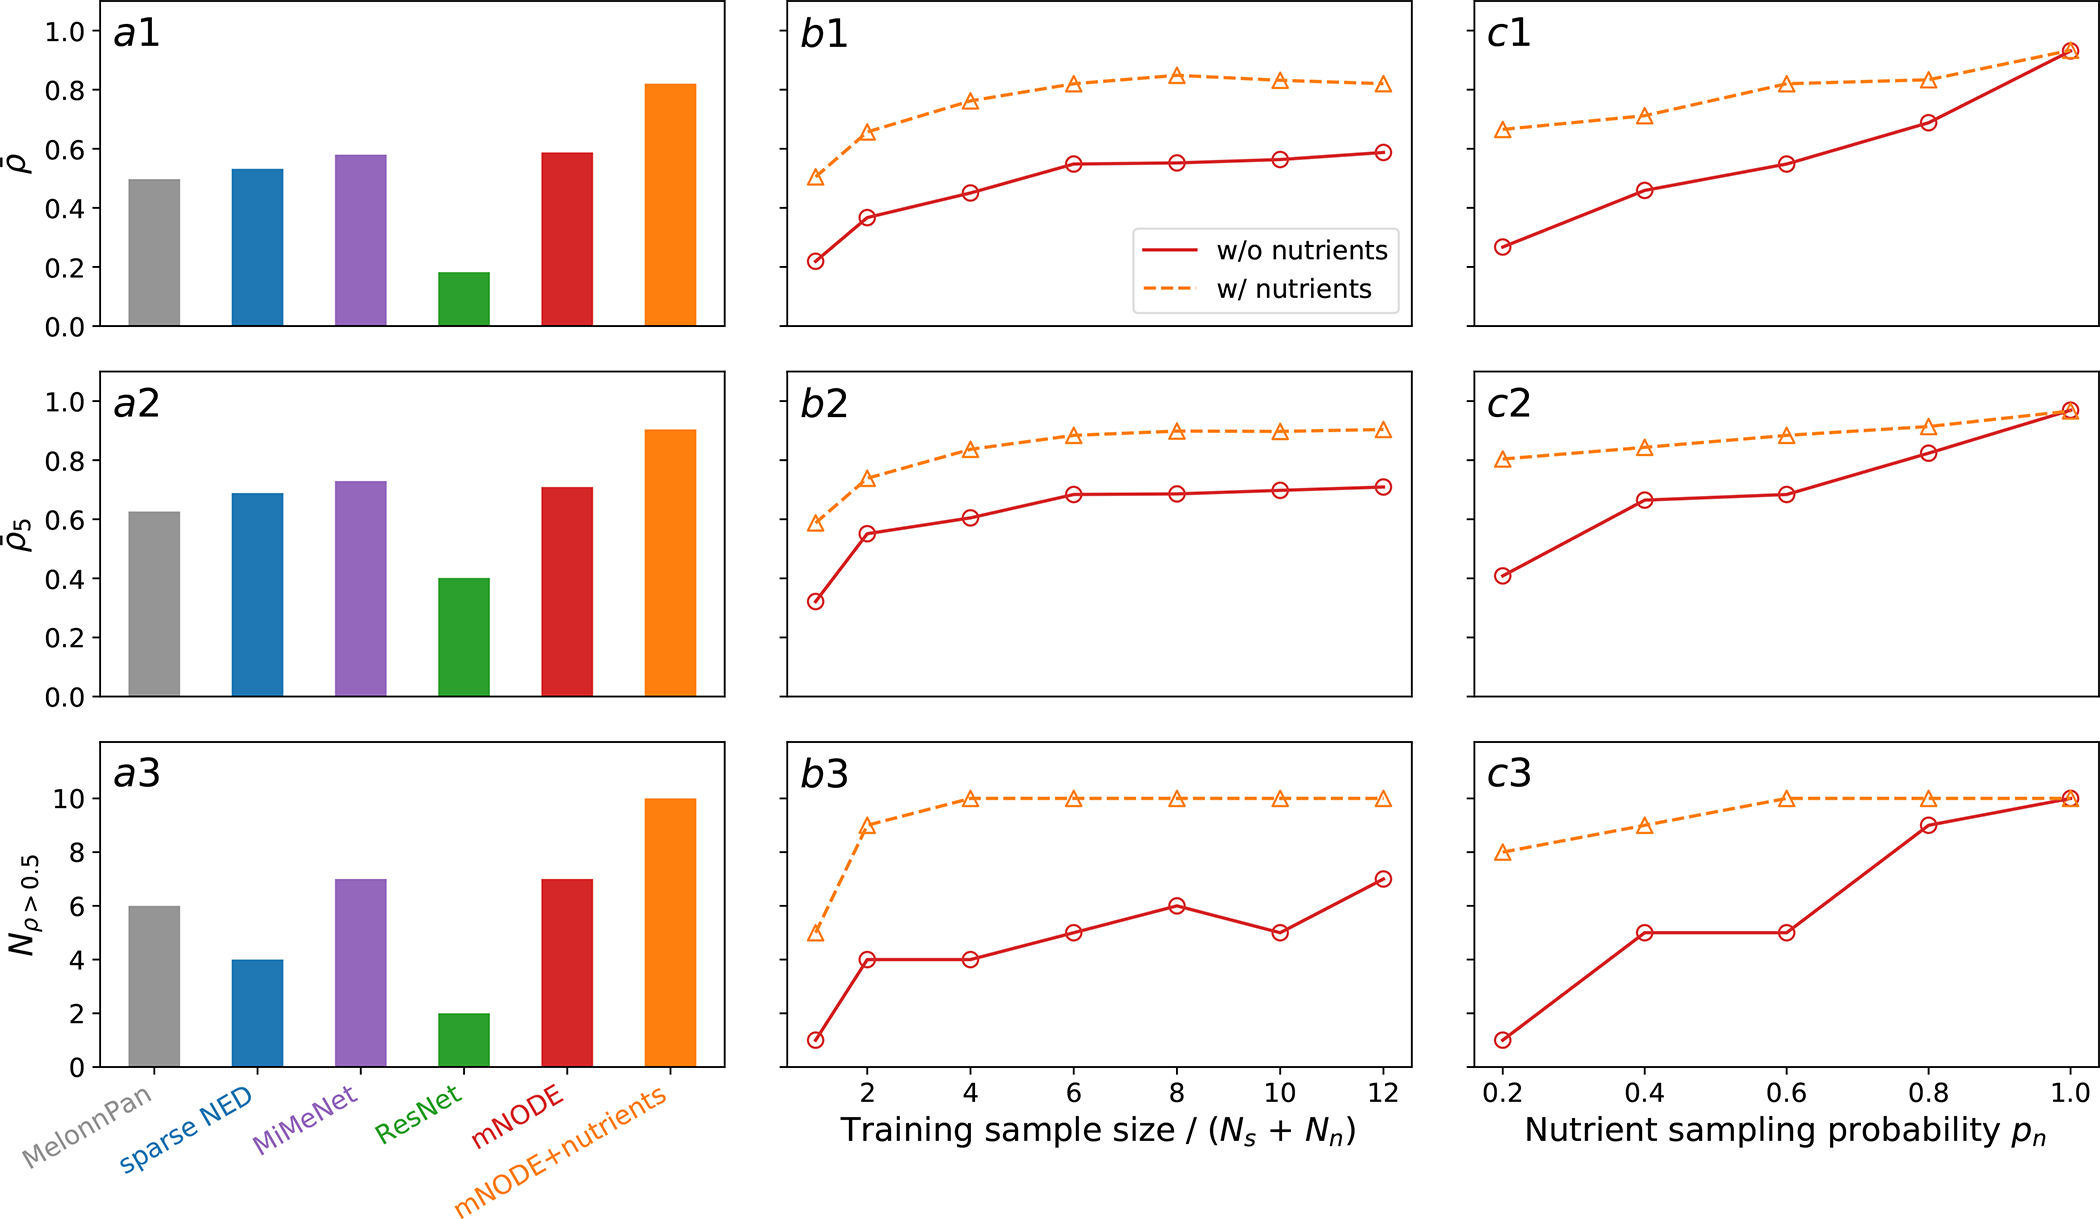
The predictive performance of mNODE is compared to other methods through three metrics: a1 the mean SCC (Spearman Correlation Coefficient) a2 the top-5 mean SCC , and a3 the number of metabolites with an SCC larger than 0.5 . b1-b3 The predictive performance of mNODE as a function of training sample size when the nutrient sampling probability (i.e. the fraction of nutrients externally supplied) and the species sampling probability (i.e. the fraction of species introduced) . c1-c3 The predictive performance of mNODE when the training sample size is 240 and the species sampling probability . Solid lines with circles are predicted results when nutrient supply rates (i.e. diets in the microbial consumer-resource model) are not included in the input of mNODE. Dashed lines with triangles are predicted results when nutrient supply rates are included in the input of mNODE.