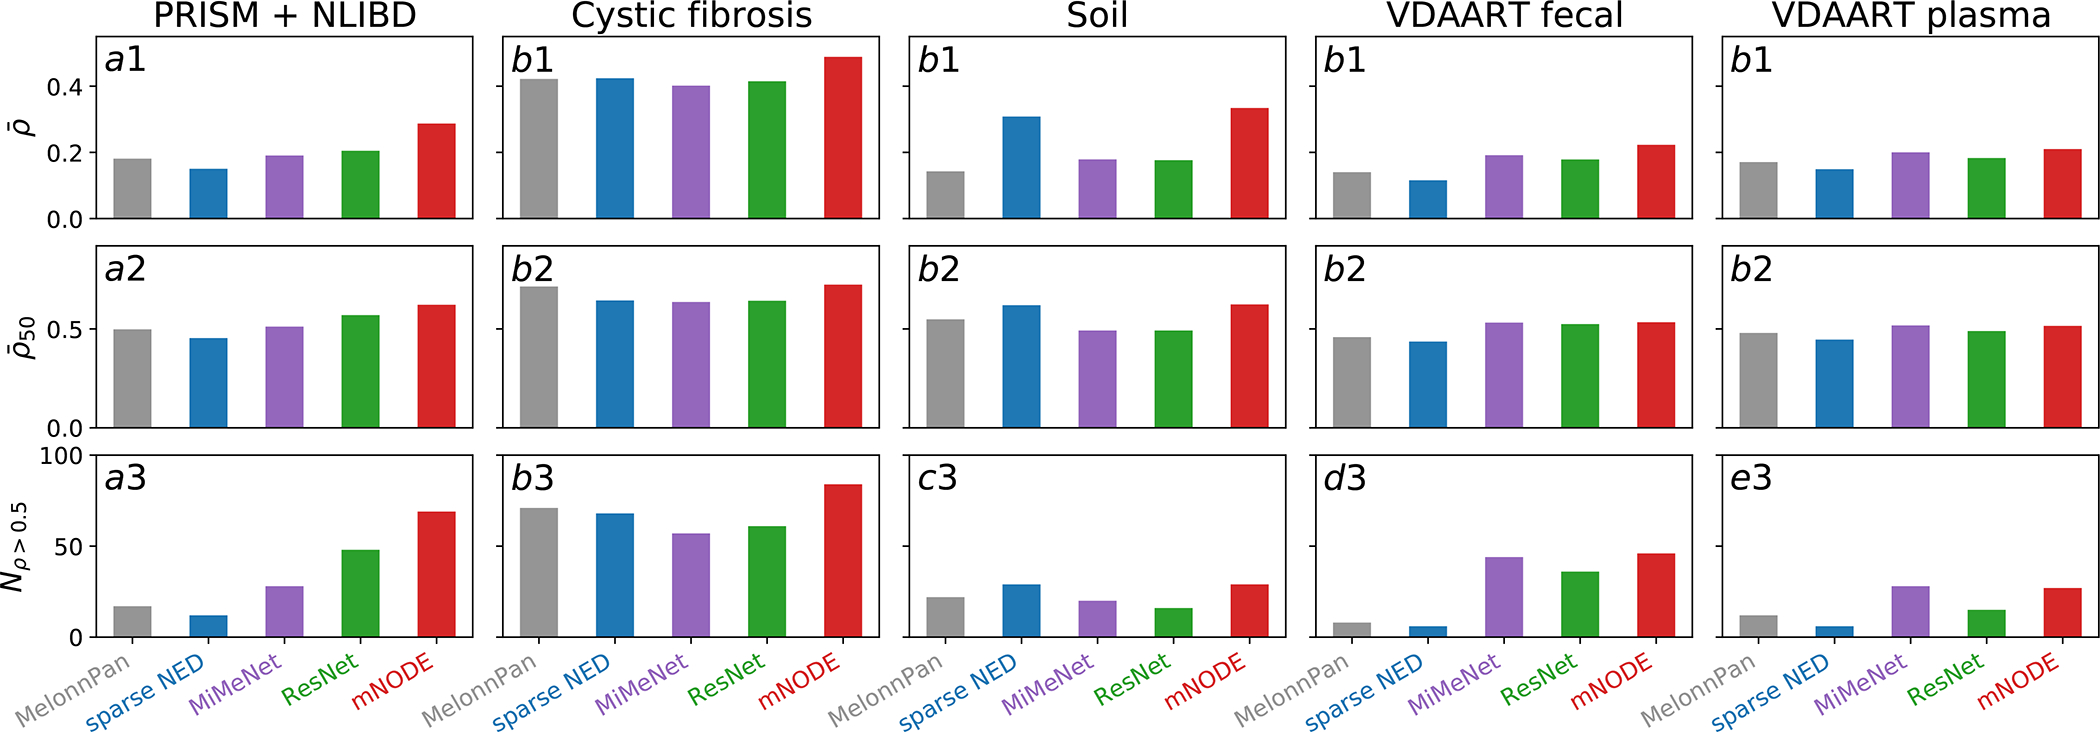
Figure 3: Performance comparison between mNODE and existing methods on real microbial community datasets.

Three metrics are adopted for comparing model performances: the mean SCC , the top-50 mean SCC , and the number of metabolites with SCCs larger than 0.5 . All datasets21,33–38 are randomly divided into training and test sets with the 80/20 ratio except for the PRISM and NLIBD dataset33. a1-a3 Performance of methods after training on the PRISM and test on the NLIBD33. b1-b3 Performance of methods on the data from lung samples of patients with cystic fibrosis21. c1-c3 Performance of methods on the data from soil biocrust samples after 5 wetting events34. d1-d3 Performance of methods on the data from fecal samples of children at age335–38. e1-e3 Performance of methods on the data from blood plasma samples of children at age 335–38.
