
Figure 5: Using susceptibility of metabolite concentrations to microbial compositions of well-trained mNODE to infer microbe-metabolite interactions on both synthetic and real data (PRISM+NLIBD).
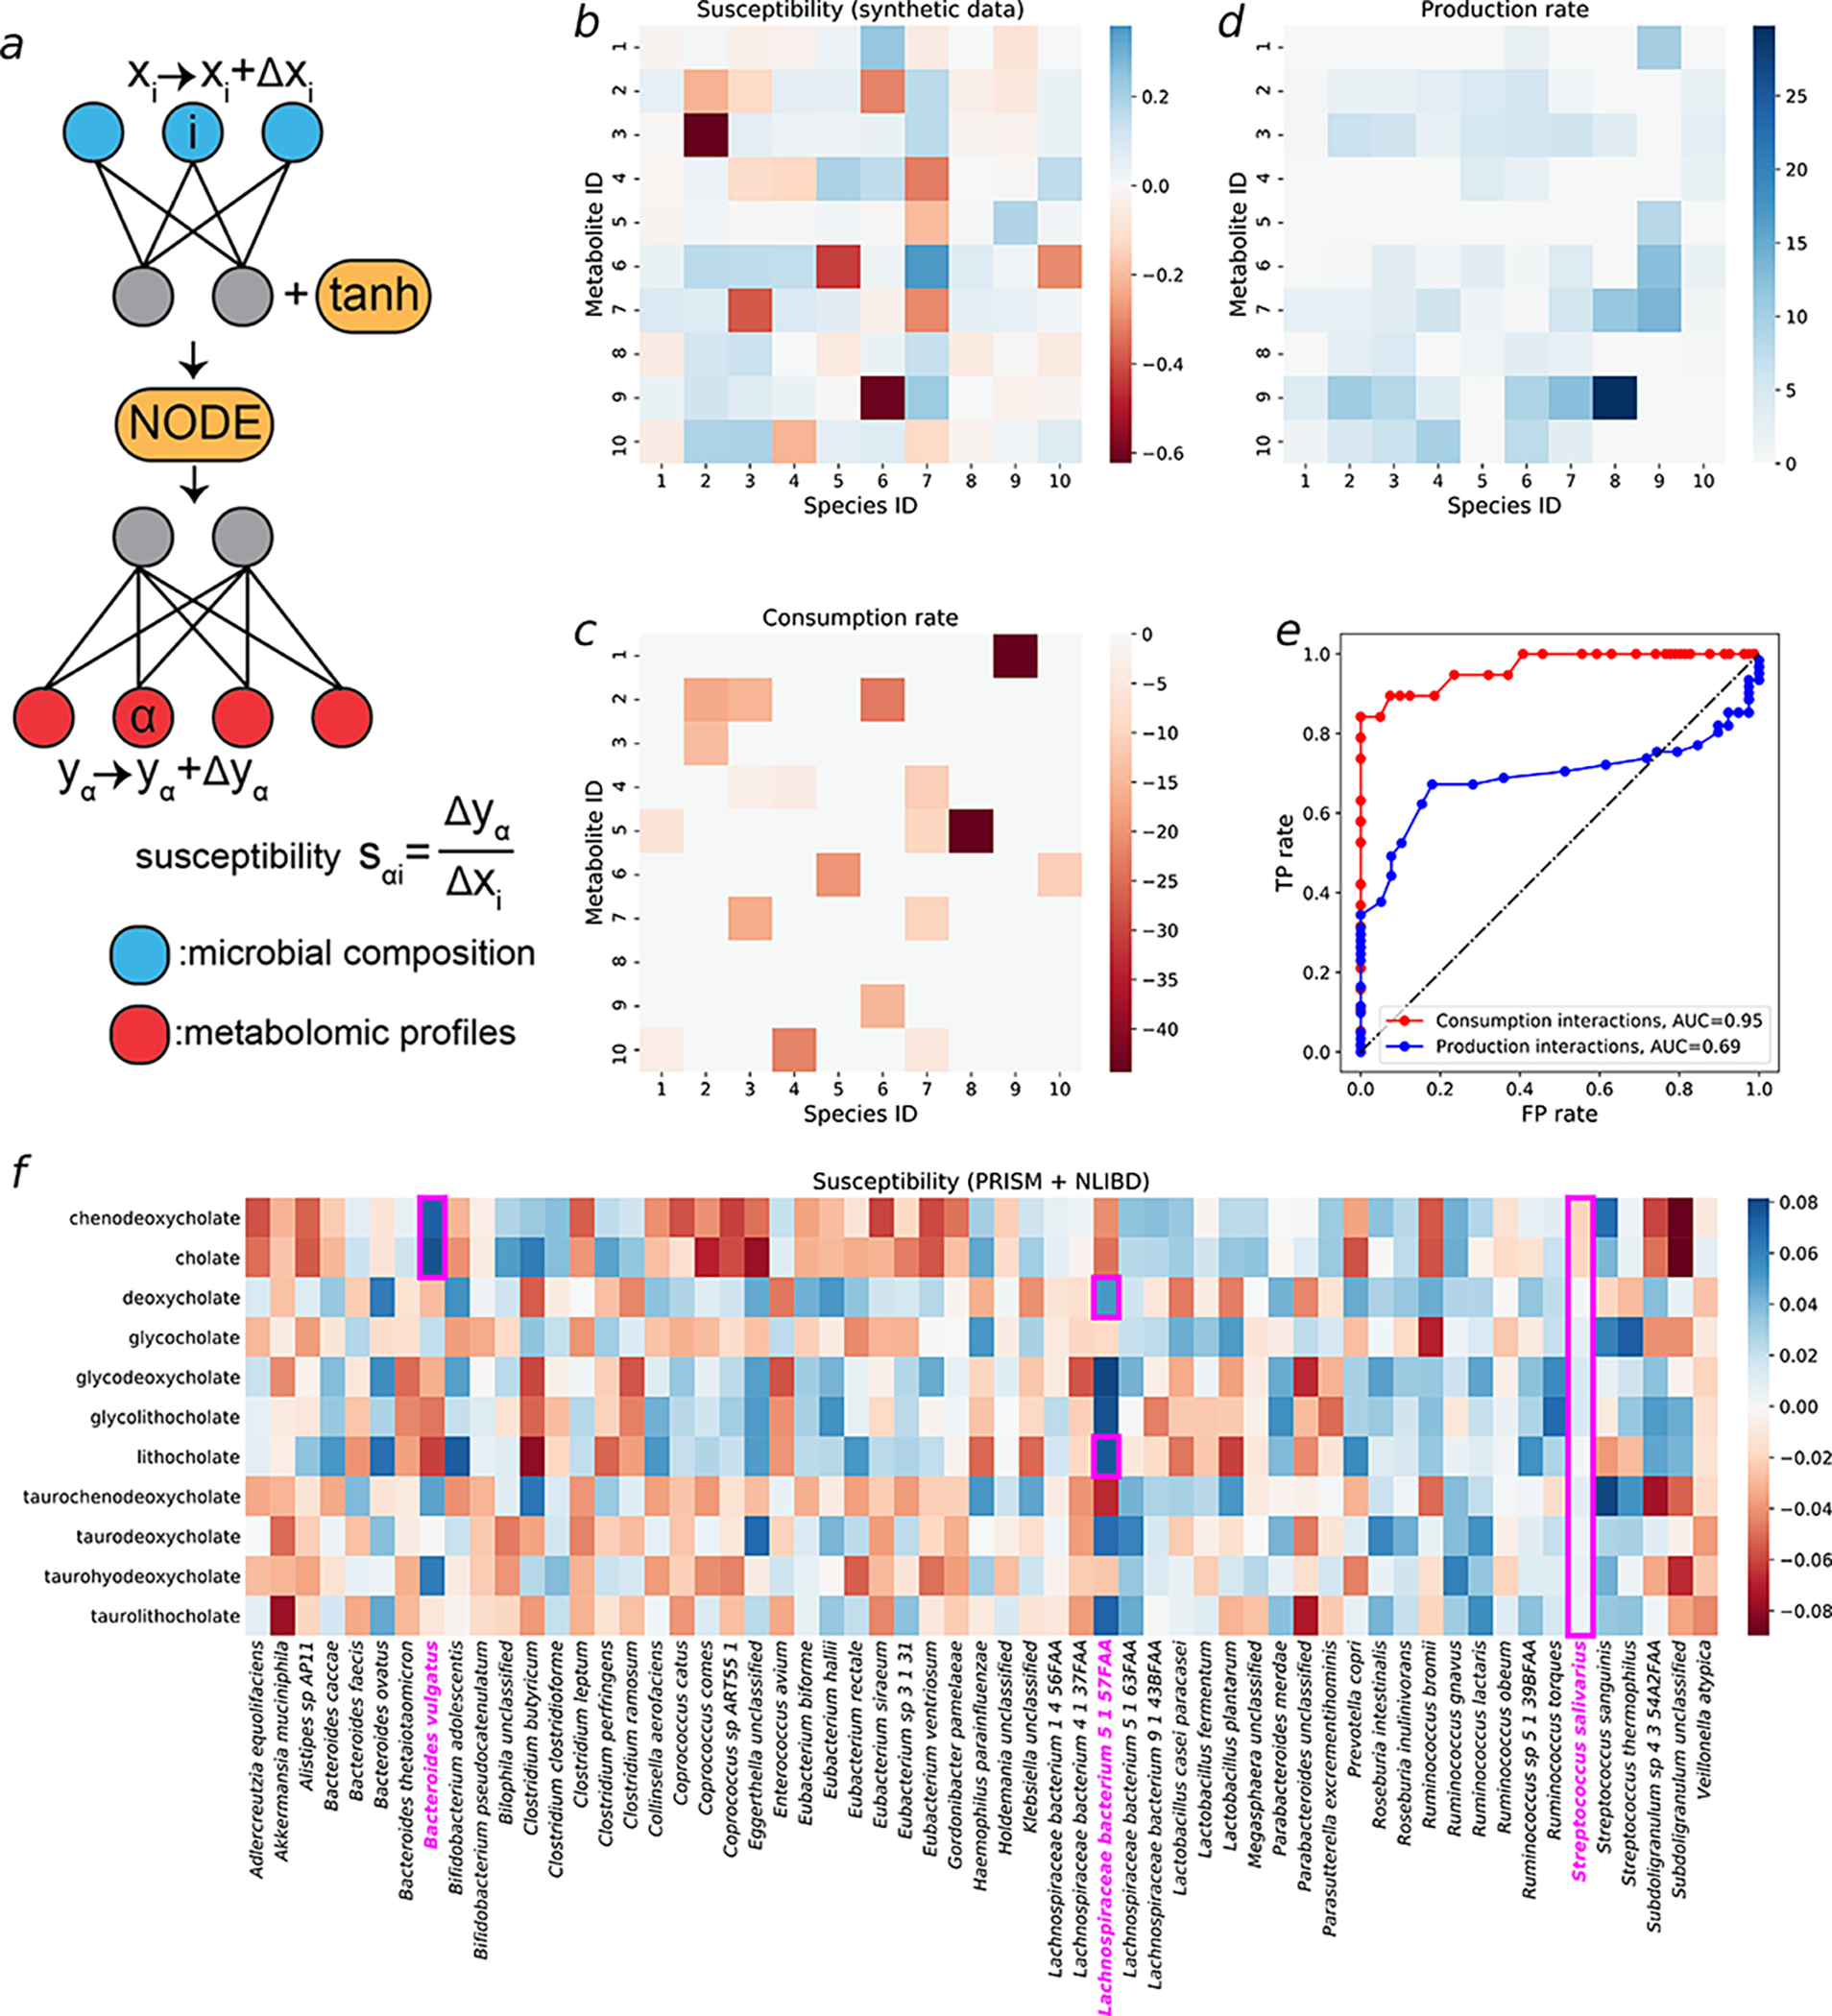
a The susceptibility of the concentration of metabolite to the relative abundance of species , denoted as , is defined as the ratio between the deviation in the concentration of metabolite and the perturbation amount in the relative abundance of species . b Susceptibility values for all microbe-metabolite pairs in the synthetic data used in Fig. 2a1–a3. c The ground-truth consumption matrix and corresponding rates in synthetic data. All consumption rates are shown as negative values for the convenience of comparison with panel b. d The ground-truth production matrix and corresponding rates in synthetic data. Details about how the production matrix is obtained can be found in the Supplementary Information section 2. e The ROC (Receiver Operating Characteristic) curve based on TP (True Positive) rates and FP (False Positive) rates which are obtained by setting different susceptibility thresholds for classifications of interactions. f The susceptibility values for all microbe-metabolite pairs in PRISM +NLIBD33 used in Fig. 3a1–a3.