
Extended Data Figure 1: Comparison of SCCs of annotated metabolites on the test set NLIBD.
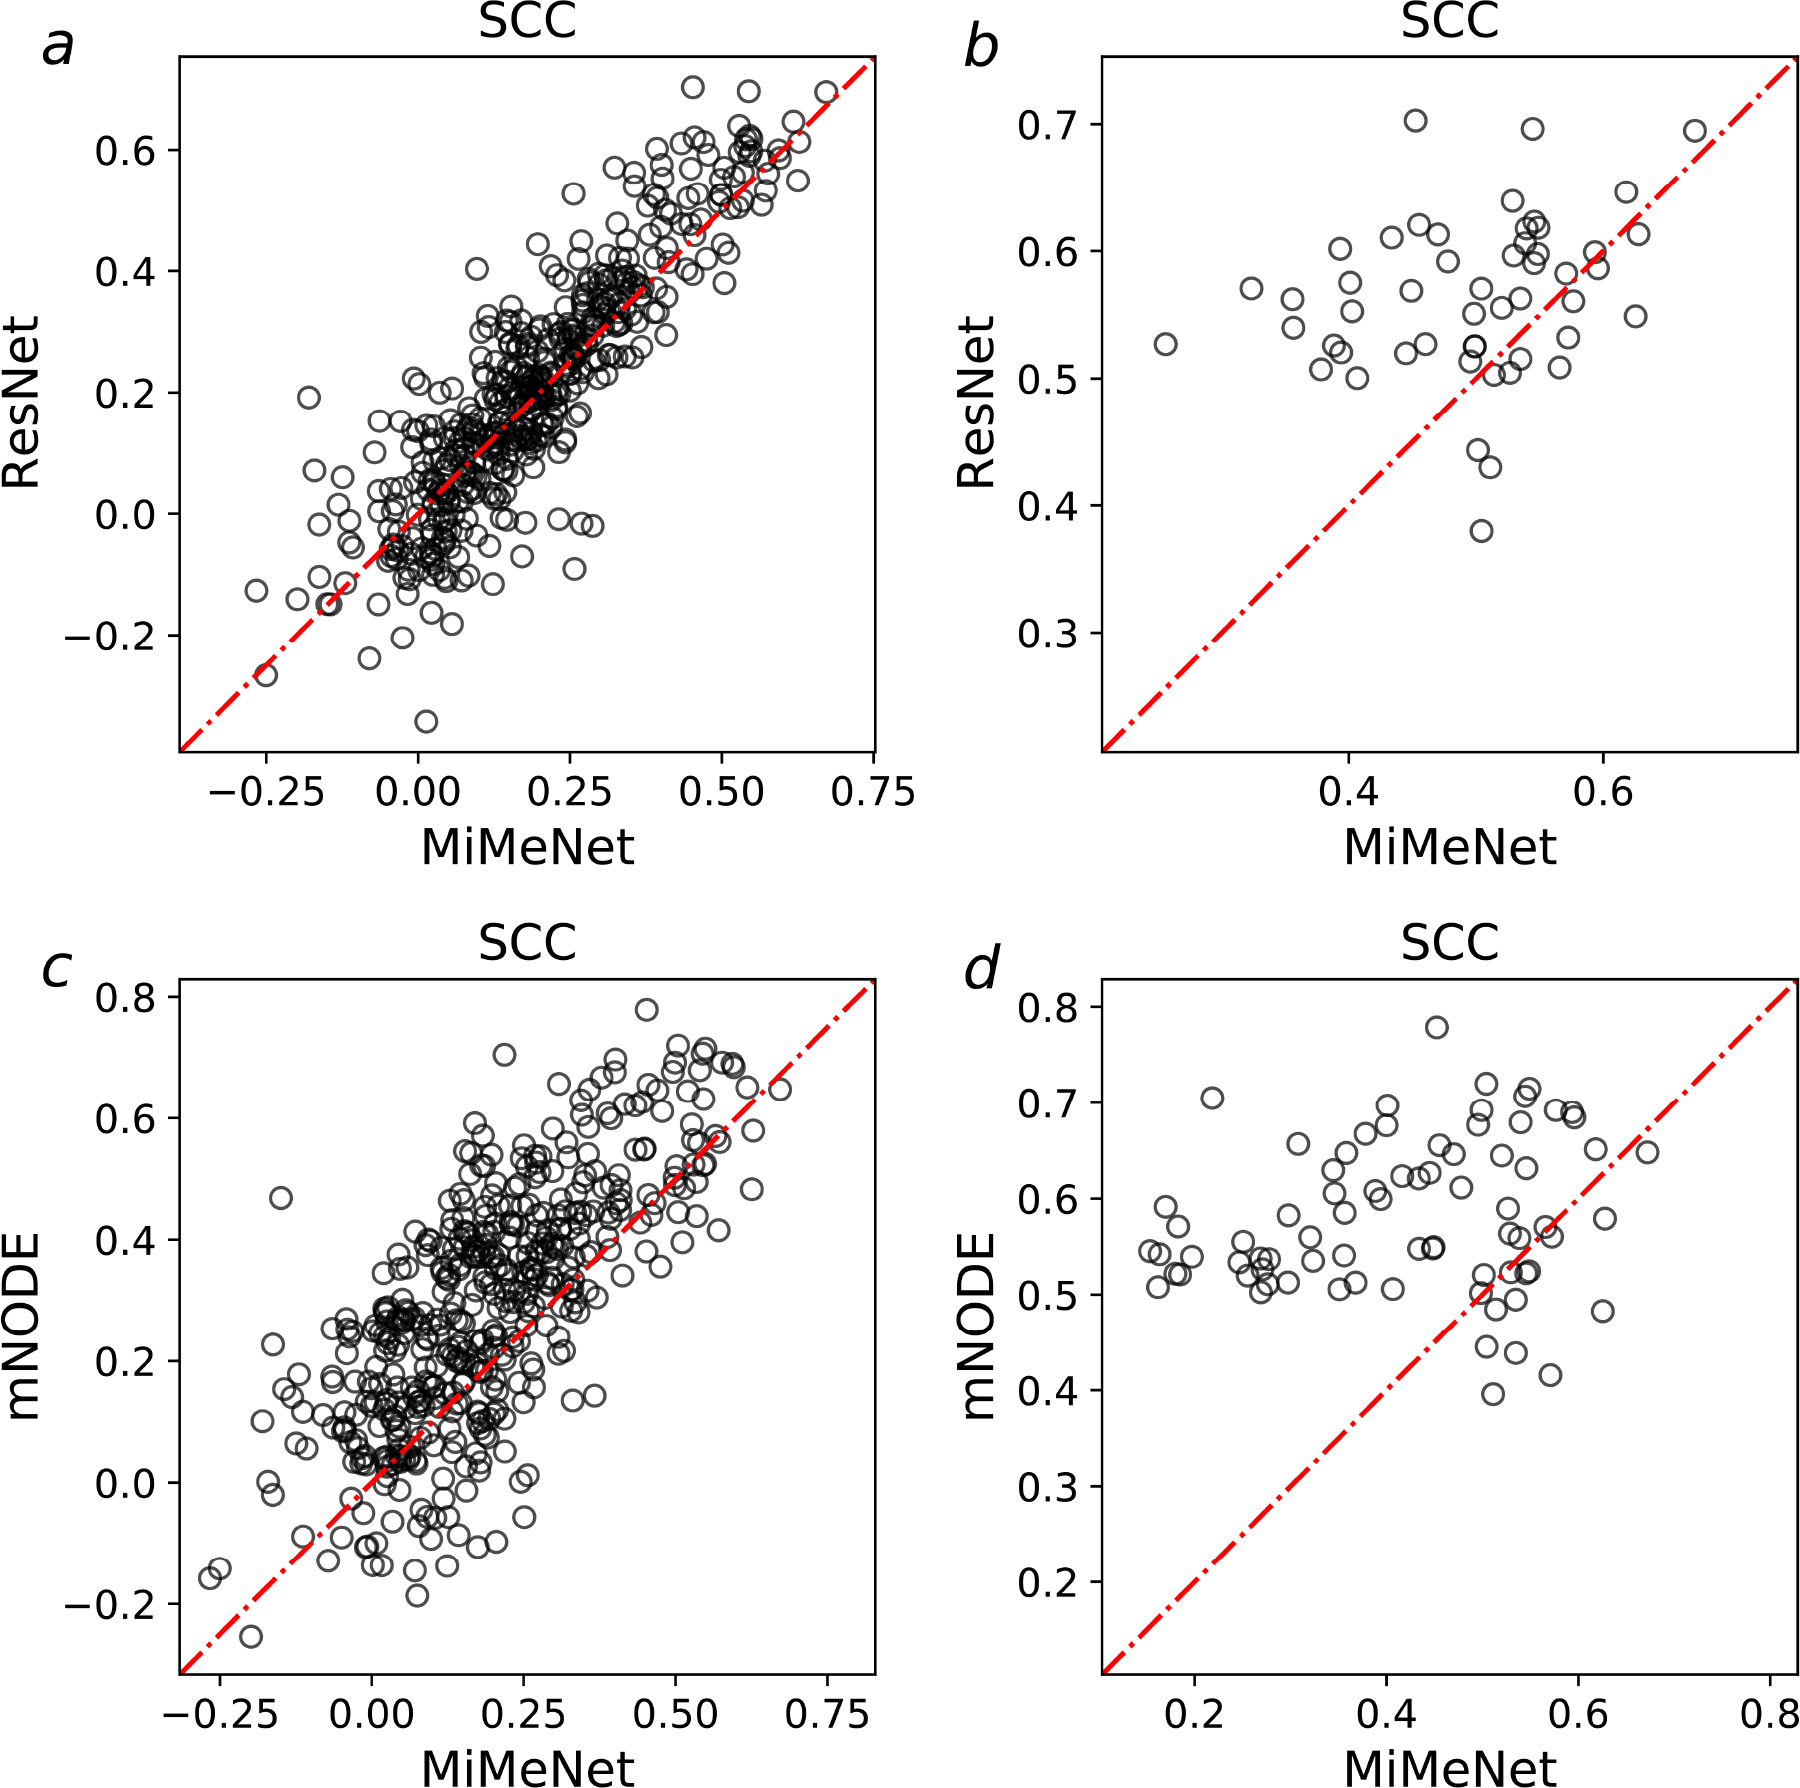
For each annotated metabolite, its SCC between its predicted values and true values across samples is computed for all computational methods. a Comparison of SCCs of all annotated metabolites between MiMeNet and ResNet. b Comparison of SCCs of all well-predicted annotated metabolites between MiMeNet and ResNet. Well-predicted metabolites are metabolites that have SCCs larger than 0.5 according to either MiMeNet or ResNet. c Comparison of SCCs of all annotated metabolites between MiMeNet and mNODE. d Comparison of SCCs of all well-predicted annotated metabolites between MiMeNet and mNODE. Well-predicted metabolites are metabolites that have SCCs larger than 0.5 according to either MiMeNet or mNODE.