
Extended Data Figure 4: The training sample size needed to reach a great predictive performance scales linearly with the number of species in synthetic data.
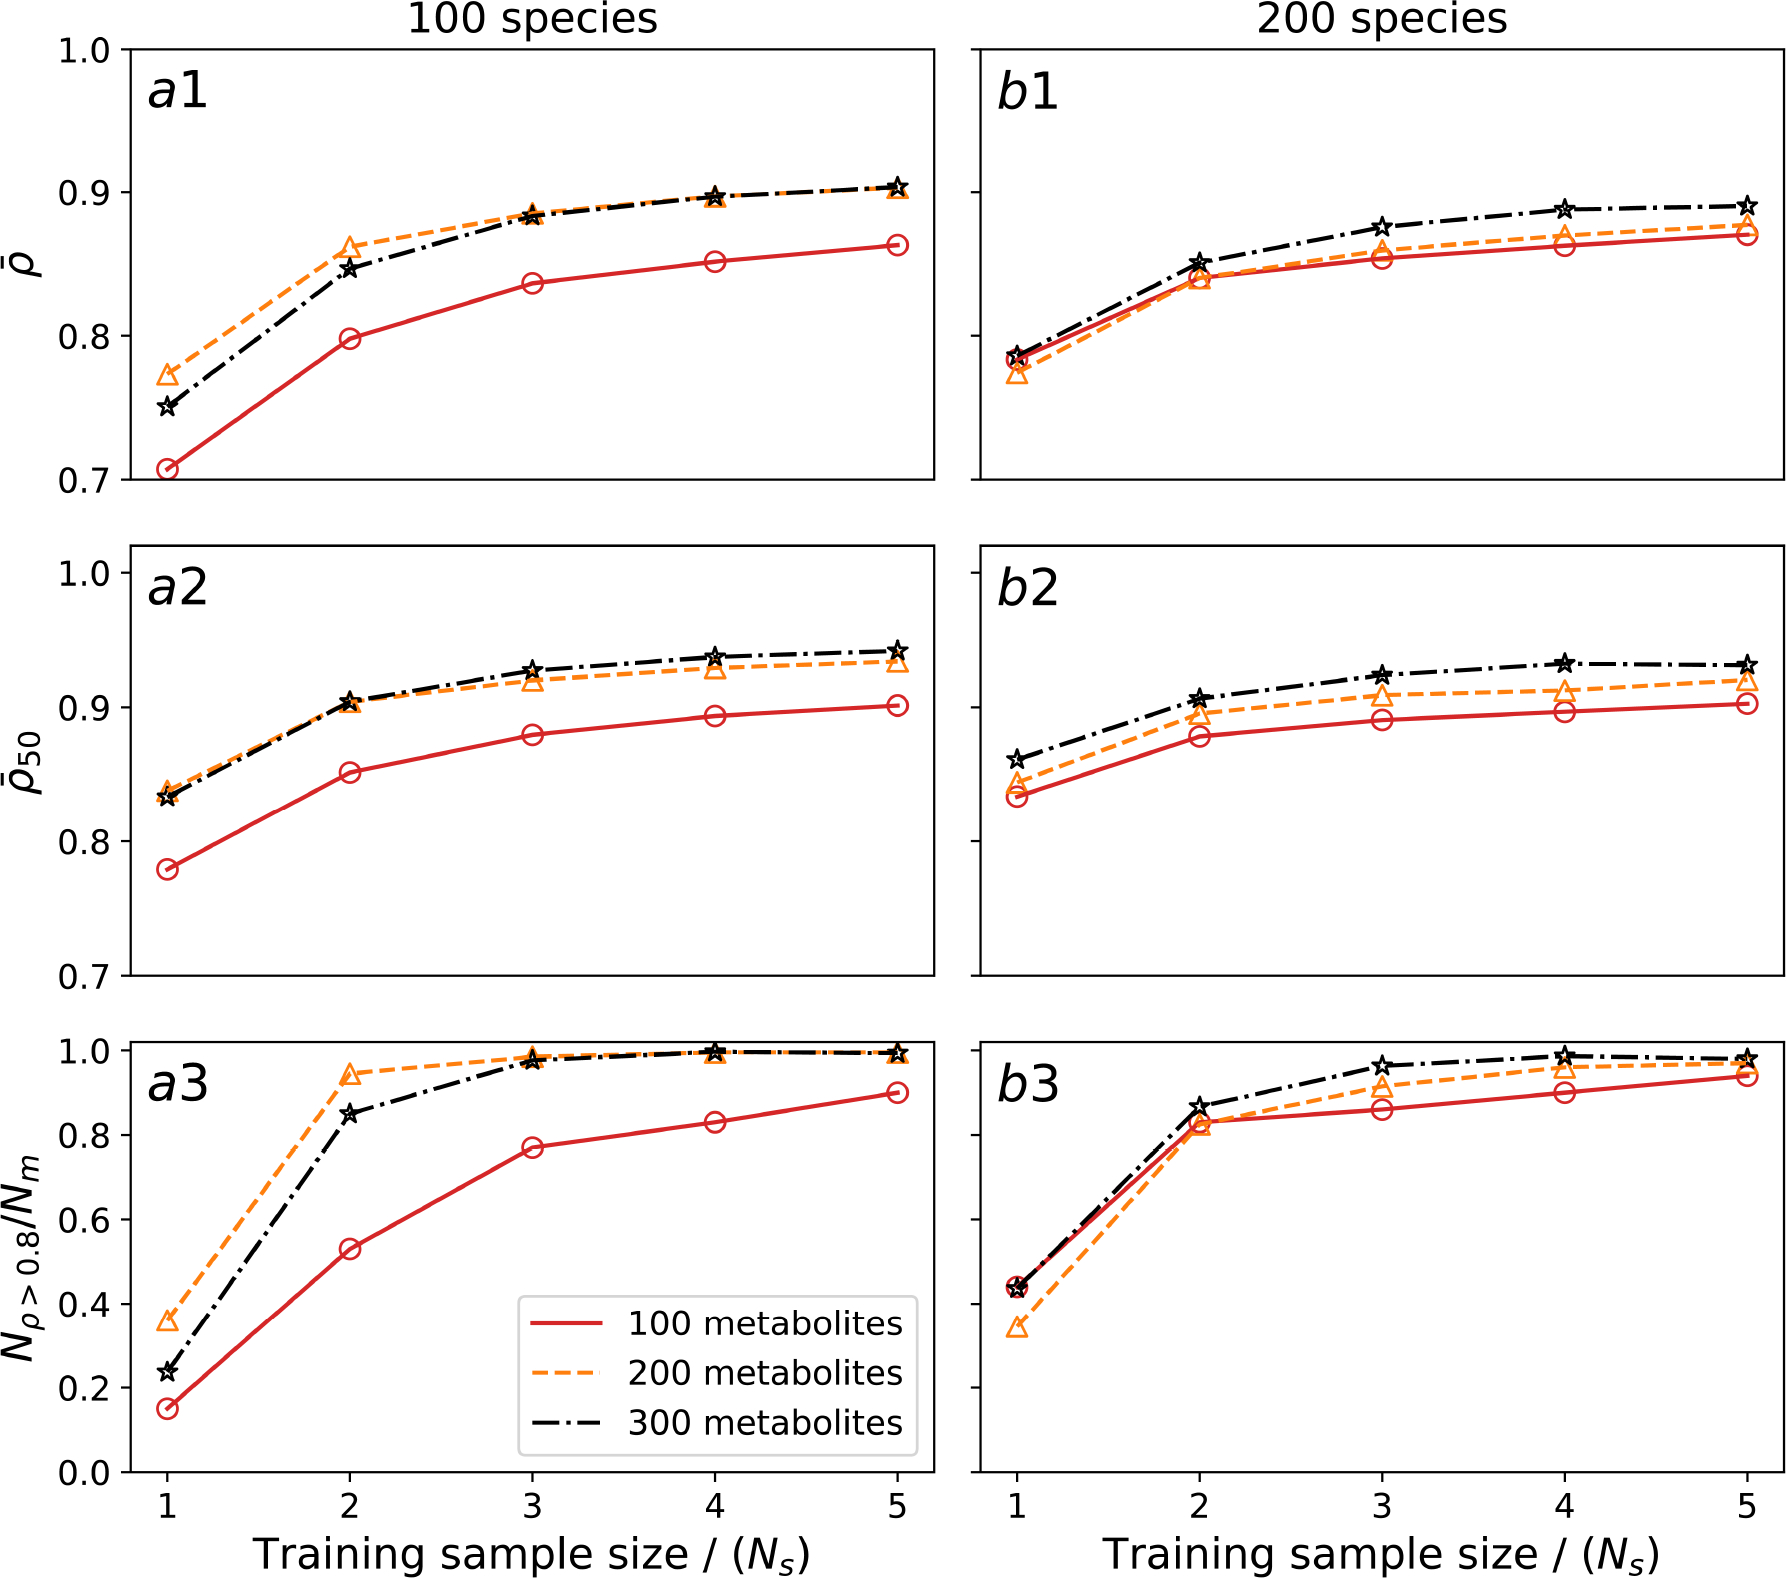
Synthetic data in this figure are generated by the microbial consumer-resource model with nutrient sampling probability . For the case with 100 species and varying number of metabolites (100, 200, or 300), three metrics are used for comparing model performances: a1 the mean SCC , a2 the top-50 mean SCC , and a3 the number of metabolites with SCCs larger than 0.8 divided by the number of metabolites . b1-b3 The performance metrics for the case with 200 species and varying numbers of metabolites (100, 200, or 300).