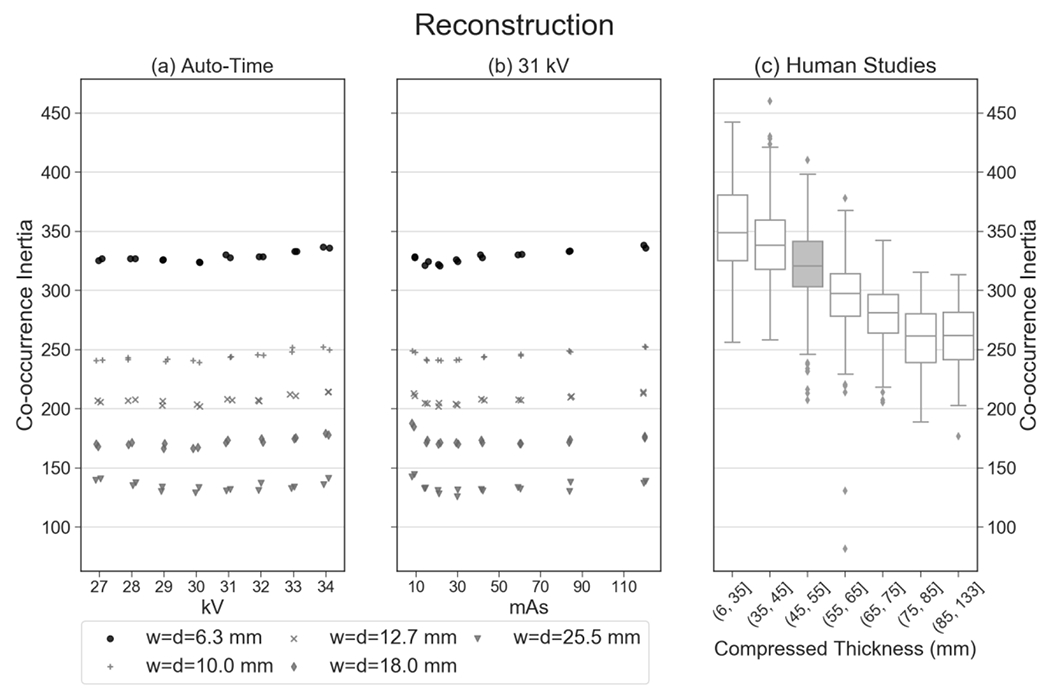
Figure 3.

These plots provide an example of a texture feature (inertia) that is reproducible in 16 auto-timed measurements (coefficient of variation of 0.0122). In addition, this feature shows clinical realism; the mean of the 16 auto-timed measurements has a percentile rank of 62.7% relative to the clinical distribution.
