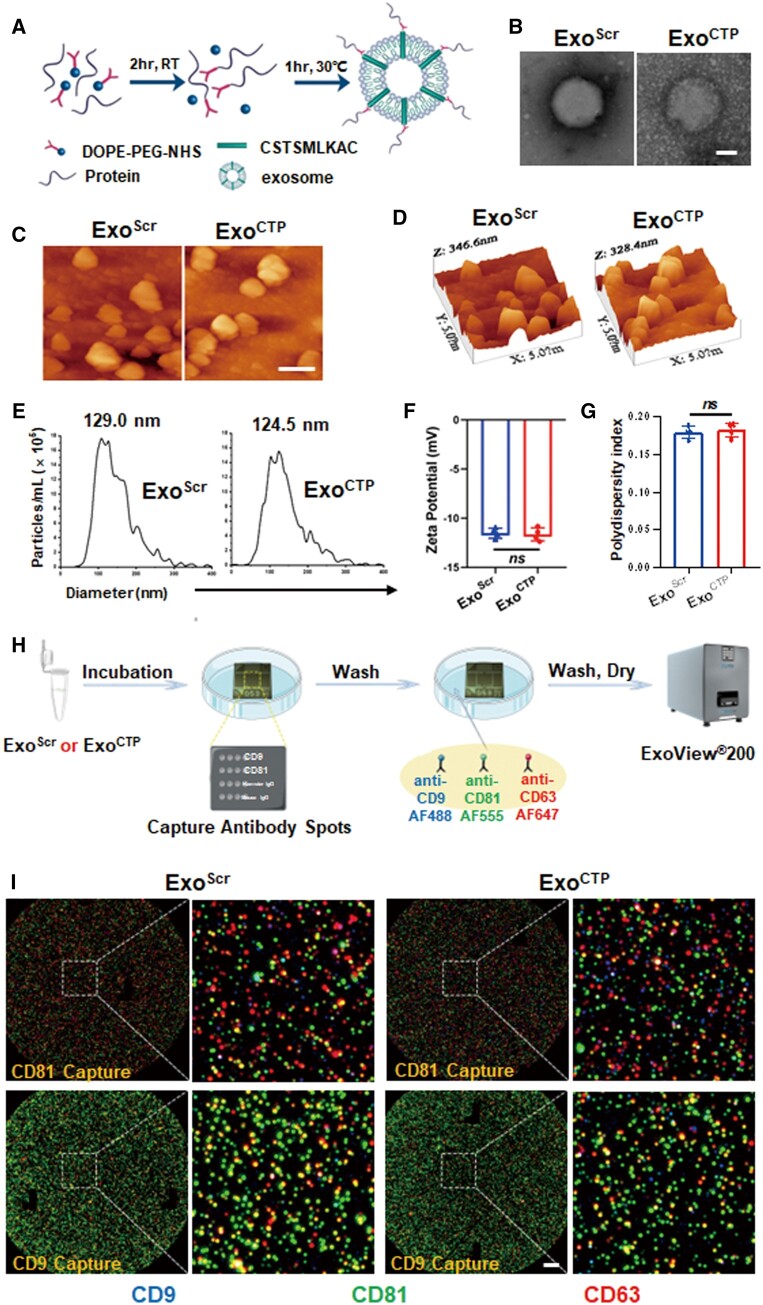
Figure 1.
Modification and characterization of ExoCTP. (A) Schematic diagram of conjugating CSTSMLKAC to exosomes by a two-step reaction. (B) Transmission electron micrograph of ExoScr and ExoCTP. Scale bar, 50 nm. (C, D) Atomic force microscopy images of ExoScr and ExoCTP. Scale bar, 200 nm. (E) Particle size distribution determined by nanoparticle tracking analysis (NTA). (F, G) Zeta potential and polydispersity index (PDI) of ExoScr and ExoCTP were determined using dynamic light scattering (n = 4). (H, I) Immunocolocation of exosomes was performed by NanoView microarray. The chips were coated with antibodies against anti-mouse CD81 and CD9 individually. To determine the co-localization, fluorescently labeled antibodies against CD9, CD81 and CD63 were employed. Scale bar, 10 μm. All data are represented as mean ± SD. Two-tailed unpaired Student’s t test was utilized. ns: not significant.

