Figure 3.
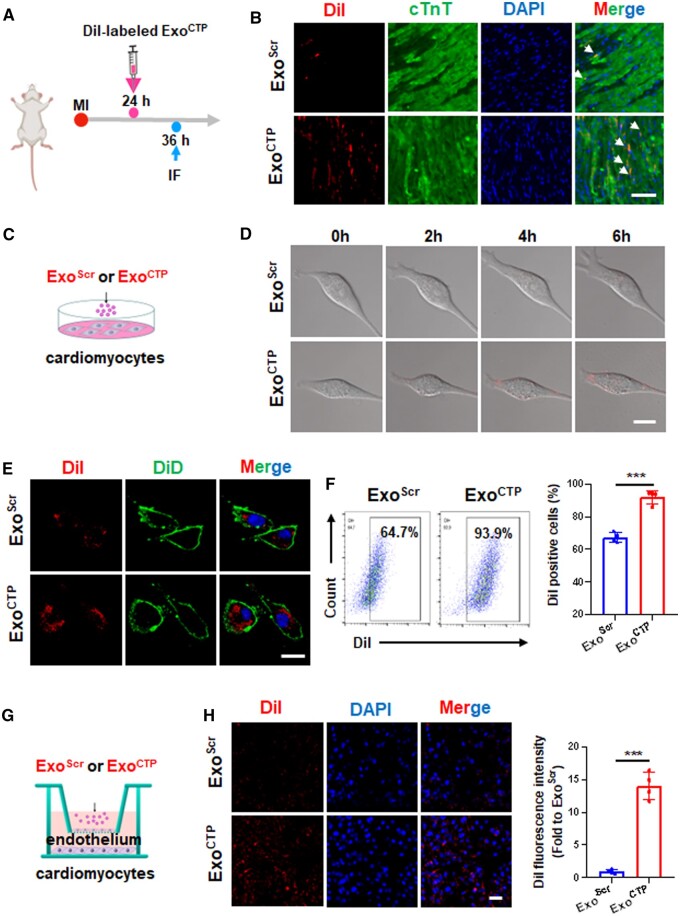
ExoCTP directly targets cardiomyocytes. (A) Schematic diagram of in vivo ExoCTP tracing. (B) Representative section images of DiI-labeled ExoScr or ExoCTP taken up by cTnT+ cardiomyocytes. Scale bar, 50 μm. (C) Schematic diagram of in vitro ExoCTP tracing. Hypoxic HL-1 cells were incubated with DiI-labeled ExoScr or ExoCTP. (D) Bright-field images at 0, 2, 4 and 6 h. Scale bar, 20 μm. (E) Immunofluorescent images with DiD-labeled cell membrane illustrating exosome absorption. Scale bar, 20 μm. (F) FACS dot plots for DiI signal in HL-1 cells (n = 4). (G, H) MCECs were plated on membrane inserts, while HL-1 cells were seeded at the bottom of the culture wells before hypoxic challenge. Representative microscopy images and quantification for DiI-labeled ExoCTP uptake (n = 4). Scale bar, 50 μm. All data are represented as mean ± SD. Two-tailed unpaired Student’s t test was utilized. ***P < 0.001.

