Figure 5.
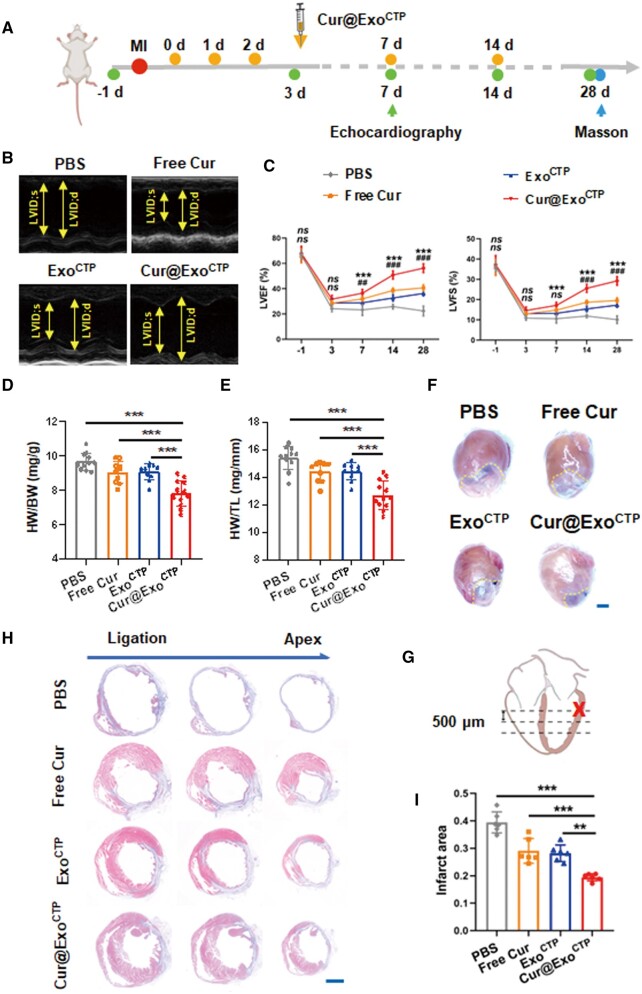
Cur@ExoCTP diminishes post-MI heart dysfunction and infarct size. (A) Schematic diagram of experimental time points. (B) Representative M-mode echocardiograms on Day 28. (C) Left ventricular (LV) EF and FS measured on Days −1, 3, 7, 14 and 28 post-treatment (n = 9–12, * for comparison between Cur@ExoCTP and ExoCTP group, # for comparison between Cur@ExoCTP and free Cur group). (D–F) Heart weight normalized to body weight or tibia length and the overall appearance of the heart on Day 28 after MI (n = 10–12). Scale bar, 2 mm. (G) Schematic representation indicating ligation (cross) and sampling (dashed line) site. Serial sectioning was conducted at intervals of 500 μm. (H, I) Masson’s staining images and quantification of infarct area on Day 28 (n = 6). Scale bar, 2 mm. All data are represented as mean ± SD. Either two-way ANOVA with Tukey's post hoc test or one-way ANOVA with Tukey's post hoc test was employed for the statistical analysis. ns: not significant, **/##P < 0.01, ***/###P < 0.001.

