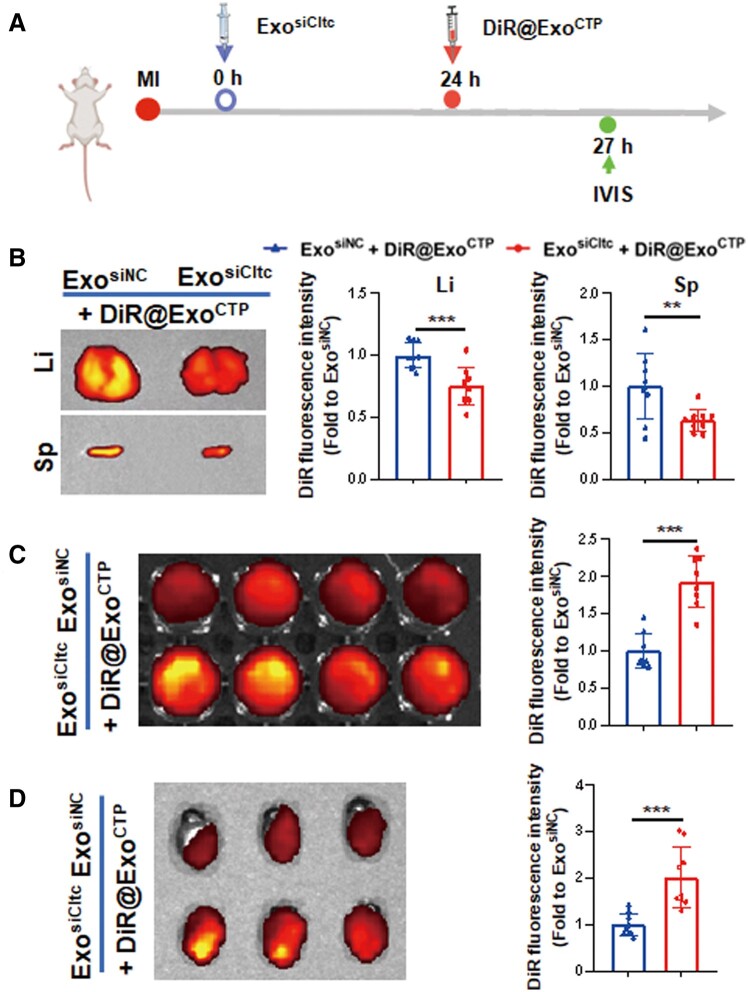
Figure 7.
ExosiCltc pre-treatment retards entrapment of ExoCTP by the liver and spleen. (A) Schematic diagram for calculating in vivo biodistribution of therapeutic ExoCTP. Mice were sequentially treated with ExosiNC or ExosiCltc and DiR-labeled ExoCTP for tracking. (B) Ex vivo fluorescence imaging and quantification of DiR signal in liver and spleen (n = 9). (C) Ex vivo imaging and quantification of DiR signal in peripheral blood (n = 8). (D) Ex vivo fluorescence imaging and quantification of DiR signal in hearts (n = 9). All data are represented as mean ± SD. Two-tailed unpaired Student’s t test was utilized. **P < 0.01, ***P < 0.001.

