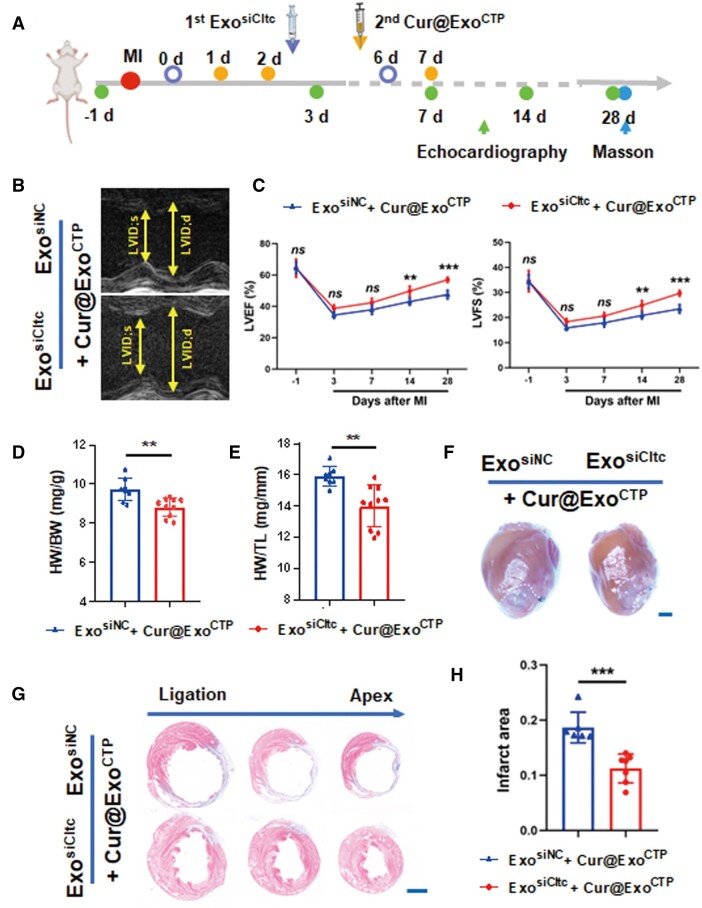
Figure 8.
Pre-injection of ExosiCltc extends cardio-protective effect of Cur@ExoCTP. (A) Schematic diagram of experimental time points. (B) Representative M-mode echocardiographic images with indicated treatments. (C) LVEF and LVFS in indicated groups (n = 8–10). (D–F) HW/BW (D), HW/TL (E), and heart whole-view (F) on Day 28 post-MI (n = 8–10). Scale bar, 2 mm. (G, H) Masson's staining images and quantification of infarct size on Day 28 (n = 6–7). Scale bar, 2 mm. All data are represented as mean ± SD. Two-way ANOVA followed with Tukey’s post hoc test or two-tailed unpaired Student’s t test was utilized. ns: not significant, **P < 0.01, ***P < 0.001.

