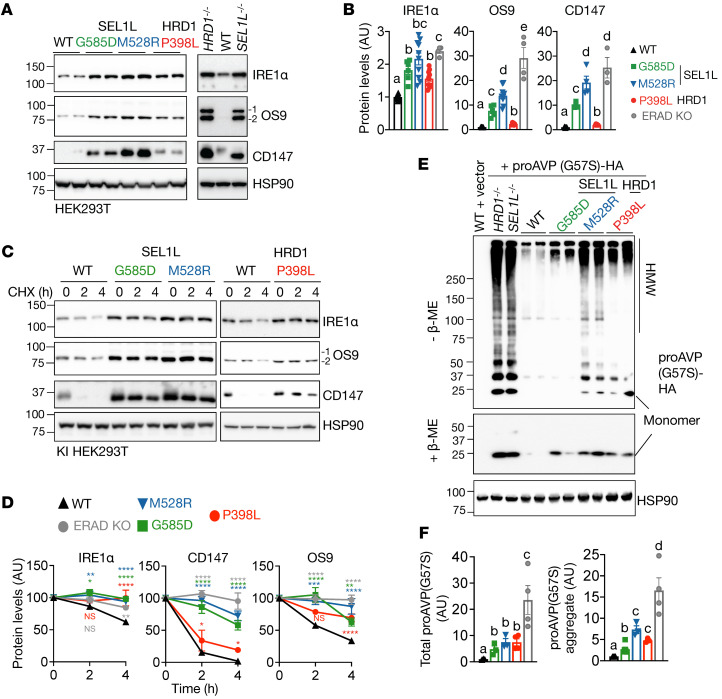
Figure 3. SEL1L and HRD1 variants are hypomorphic with impaired ERAD function toward misfolded endogenous and model substrates.
(A and B) Western blot analysis of known ERAD endogenous substrates IRE1α, OS9, and CD147 in KI HEK293T cells, with quantitation shown in B. n = 4–16 (IRE1α); n = 4–12 (OS9); n = 3–12 (CD147). OS9.1 and OS9.2 were quantified together as OS9. SEL1L–/– and HRD1–/– HEK293T cells were included as controls. (C and D) Cycloheximide (CHX) chase analysis of known ERAD endogenous substrates IRE1α, OS9, and CD147 in KI HEK293T cells, with quantitation shown in D. n = 3–8 (IRE1α); n = 3–6 (OS9); n = 3–8 (CD147). SEL1L and HRD1 variants were analyzed separately with their own WT controls. Quantitation normalized to WT controls. Western blot data for ERAD KO samples shown in Supplemental Figure 3. (E and F) Reducing and nonreducing SDS-PAGE and Western blot analysis of HMW aggregates of proAVP(G57S) in KI HEK293T cells, with quantitation shown in F. n = 3–6 for group. n, individual cell samples. For A, C, and E, SEL1L and HRD1-KO HEK293T cells were included as controls and quantitated as ERAD KO. The replicates in Western blot are technical replicates. Data are represented as means ± SEM. Quantitation of the band intensities was compared using 1-way ANOVA with post hoc Tukey-Kramer test (B and F) or 2-way ANOVA followed by multiple comparisons test (D). For B, comparisons between different letters (a–d) represents P < 0.05. *P < 0.05; **P < 0.01; ***P < 0.001; ****P < 0.0001.

