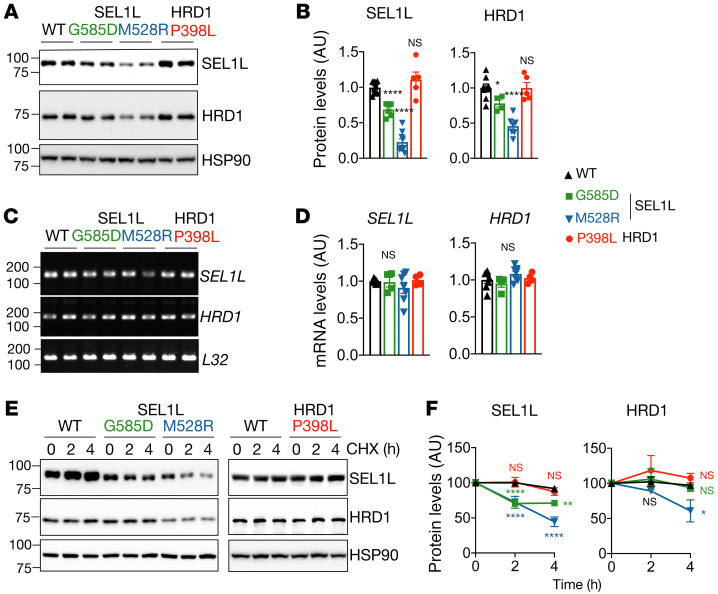
Figure 5. Reduced SEL1L-HRD1 protein level and stability for SEL1L M528R variant, not the other 2 variants.
(A and B) Western blot analysis of SEL1L and HRD1 in KI HEK293T cells expressing indicated variants, with quantitation shown in B. n = 8–10 (WT); n = 4–6 (G585D); n = 7–9 (M528R). (C and D) RT-PCR analysis of SEL1L and HRD1 transcript levels in KI HEK293T cells, with quantitation shown in D. n = 4–7 per group. L32, loading control. (E and F) Cycloheximide chase analysis of SEL1L and HRD1 in KI HEK293T cells, with quantitation shown in F. n = 10 (WT); n = 3–4 (G585D); n = 4–5 (M528R); n = 3–5 (P398L). SEL1L and HRD1 variants were analyzed separately with their own WT controls. Quantitation normalized to WT controls. n, individual cell samples. Data are represented as means ± SEM. *P < 0.05; **P < 0.01; ****P < 0.0001, 1-way ANOVA followed by Dunnett’s multiple-comparisons test (B and D); 2-way ANOVA followed by multiple comparisons test (F).

