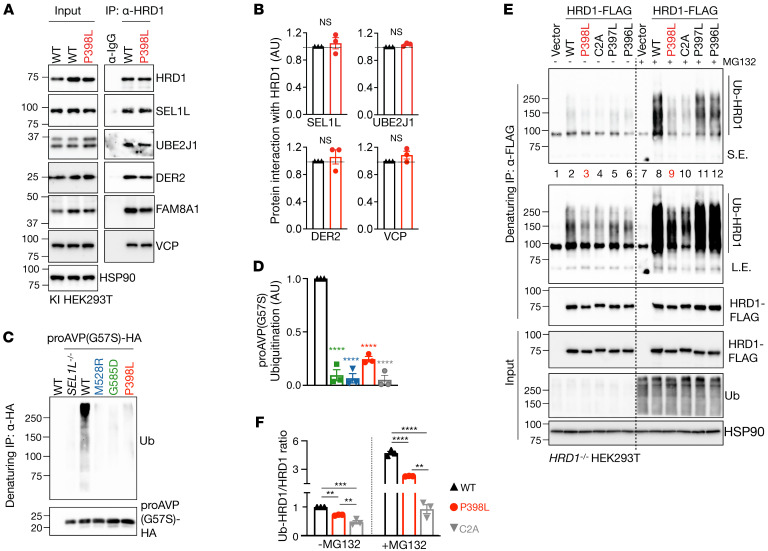
Figure 7. HRD1 P398L variant impairs HRD1 ubiquitination.
(A and B) IP of HRD1 in HRD1P398L KI HEK293T cells to test its interaction with components of the ERAD complex, with quantitation shown in B. n = 3 per group. (C and D) Denaturing IP of HA-agarose in KI HEK293T cells expressing indicated variants transfected with a model substrate proAVP (G57S)-HA to measure substrate ubiquitination, with quantitation shown in D. n = 3 per group. (E and F) Denaturing IP of FLAG-agarose in HRD1–/– HEK293T cells transfected with indicated HRD1 variants, with or without 10 μM MG132 for 2 hours, to measure HRD1 ubiquitination, with quantitation shown in F. n = 3 per group. n, individual cell samples. Data are represented as means ± SEM. **P < 0.01; ***P < 0.001; ****P < 0.0001, 2-tailed Student’s t test (B); 1-way ANOVA followed by Dunnett’s multiple-comparisons test (D and F).

