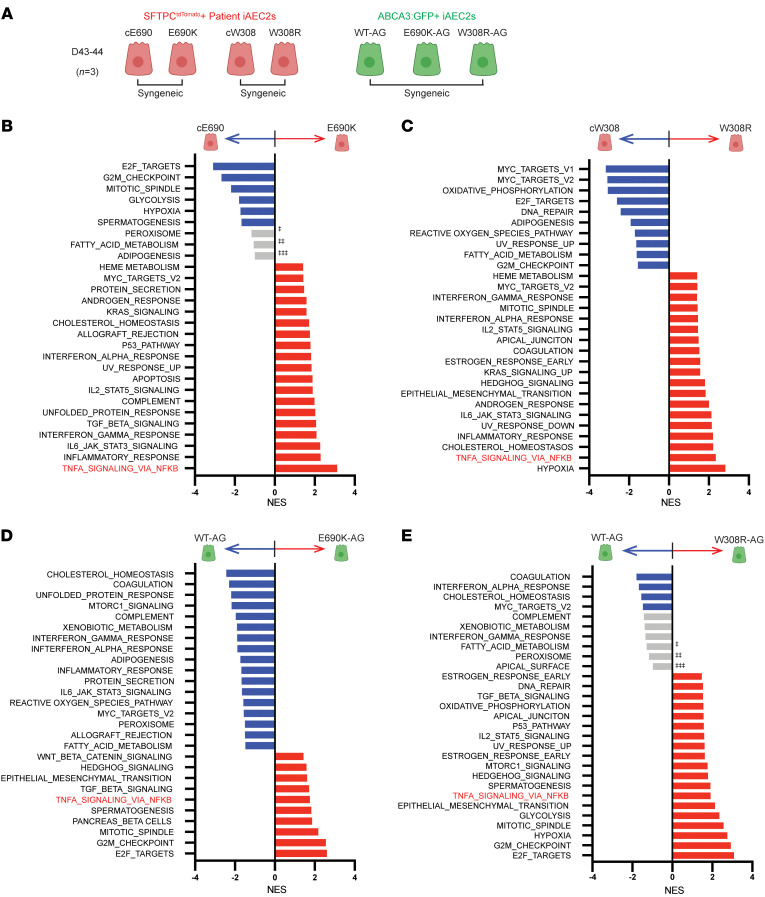
Figure 5. Bulk RNA-Seq of ABCA3 mutant iAEC2s reveals upregulation of inflammatory pathways including the NFκB pathway.
(A) Schematic for RNA-Seq profiling of sorted, pure populations of day 43–44 SFTPCtdTomato+ syngeneic patient iAEC2s versus their gene corrected, paired iAEC2s (E690K, cE690; W308R, cW308 lines from Figure 1) and ABCA3:GFP+ WT (WT-AG) iAEC2s along with their paired CRISPR/Cas9 mutagenized iAEC2s (E690K-AG, W308R-AG from Figure 3). Biological replicates (n = 3) were each sorted on the indicated fluorochrome before RNA extraction. (B) Bar graph showing normalized enrichment scores (NES) of gene sets enriched in E690K patient iAEC2 (red bars) versus corrected cE690 iAEC2s (blue bars) following GSEA (FDR < 0.05). Gray bars, FDR > 0.05, ‡FDR = 0.26. ‡‡FDR = 0.46, ‡‡‡ FDR = 0.55. (C) Bar graph showing NES of gene sets enriched in W308R patient iAEC2s (red bars) versus corrected cW308 iAEC2s (blue bars) following GSEA (FDR < 0.05). (D) Bar graph showing NES of gene sets enriched in E690K-AG iAEC2s (red bars) versus WT-AG iAEC2s (blue bars) following GSEA (FDR < 0.05). (E) Bar graph showing NES of gene sets enriched in W308R-AG iAEC2s (red bars) versus WT-AG iAEC2s (blue bars) following GSEA (FDR < 0.05). Gray bars, FDR > 0.05. ‡FDR = 0.11. ‡‡FDR = 0.2, ‡‡‡FDR = 0.54.

