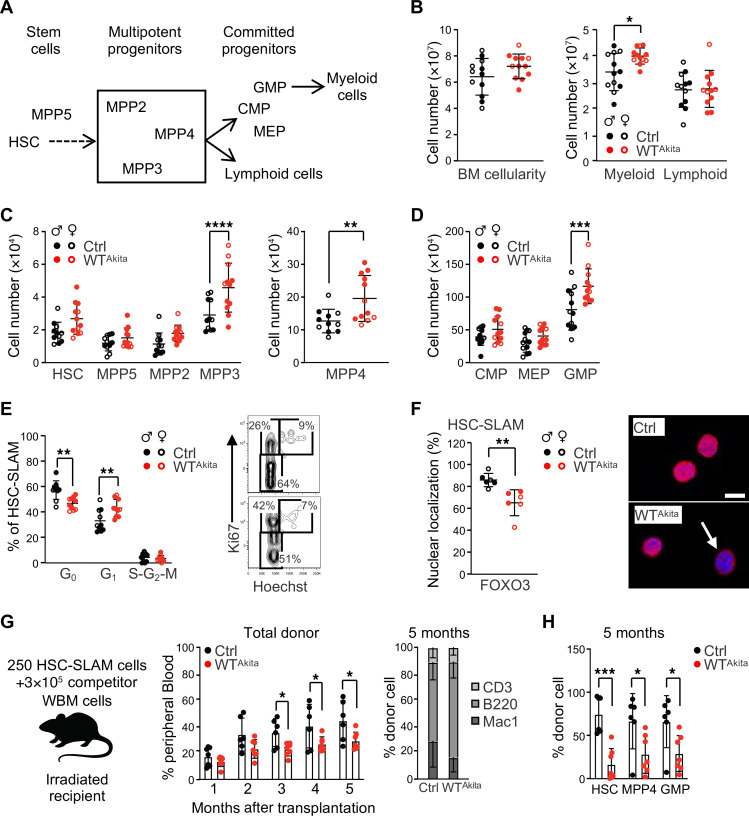
Figure 3. Offspring born to diabetic pregnancy display altered steady-state hematopoiesis.
(A) Schematic of the murine hematopoietic hierarchy. (B) BM cellularity and absolute numbers of BM myeloid/lymphoid cells in adult WTAkita offspring (n = 12). (C and D) Absolute numbers of HSPC populations in the BM of adult Ctrl and WTAkita offspring (n = 11–12). CMP, common myeloid progenitor (Lineage–c-Kit+Sca-1–CD34+FcγR–); MEP, megakaryocyte/erythroid progenitor (Lineage–c-Kit+Sca-1–CD34–FcγR–). (E) Percentage of HSC distribution in cell-cycle phases in adult Ctrl and WTAkita offspring. Right panel shows representative FACS plots for Ki67/ Hoechst 33342 staining (n = 10). (F) Percentage of HSCs isolated from Ctrl and WTAkita offspring that present FOXO3 nuclear localization at steady state (n = 6 with 50 individual cells analyzed for each). Right panel shows representative images of FOXO3 immunofluorescence analysis. Scale bar: 10 μm. (G and H) Competitive hematopoietic reconstitution assay for HSCs isolated from Ctrl (n = 6) and WTAkita (n = 7) offspring from 1 experiment: PB chimerism over time (G) and BM chimerism for HSC subsets, 20 weeks after transplantation (H). Data are represented as means ± SD. Two-way ANOVA with Šidák’s post hoc test (B, C, D, G, and H) or with Tukey’s post hoc test (E); unpaired 2-tailed Student’s t test (F). *P ≤ 0.05; **P ≤ 0.01; ***P ≤ 0.0005; ****P ≤ 0.0001.

