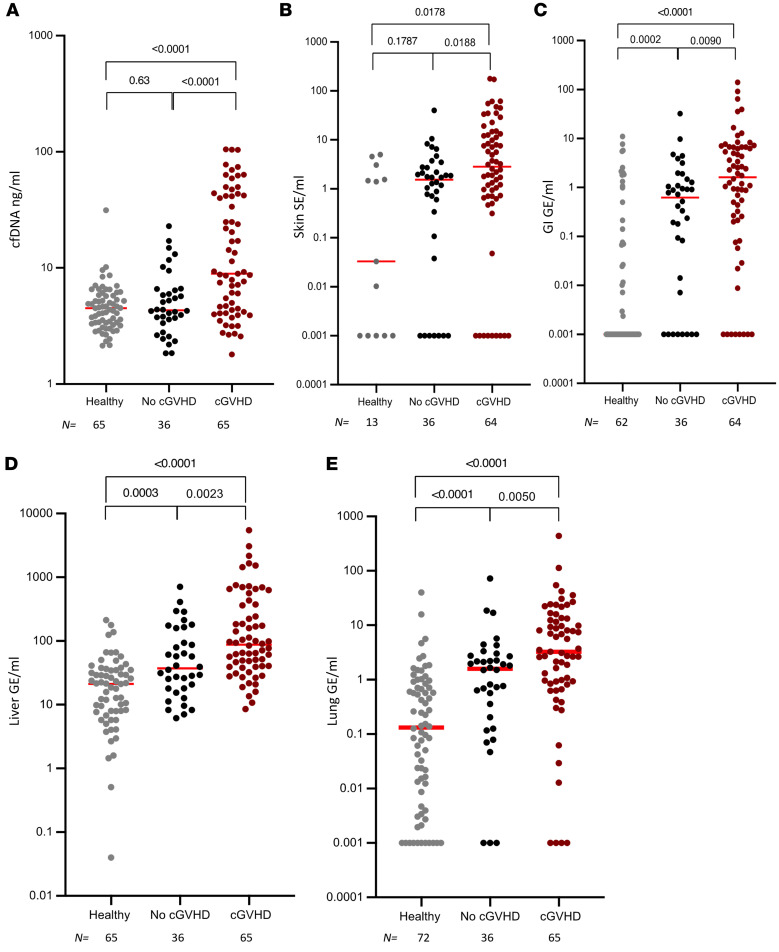
Figure 3. cfDNA levels correlate with clinical presence of cGVHD.
(A) Level of total cfDNA in healthy volunteers and patients undergoing allogeneic HCT with and without clinical signs of cGVHD. (B–E) Tissue-specific cfDNA (genome equivalents per mL plasma) in healthy volunteers and patients undergoing allogeneic HCT with and without clinical signs of cGVHD, using average signals from methylation markers of skin (B), gastrointestinal tract (C), liver (D) and lung (E). Each dot represents 1 plasma sample. Statistical analysis was performed using nonparametric 2-tailed Mann-Whitney test. cfDNA ng/mL, total cell free DNA levels in ng/mL; GI, gastrointestinal.

