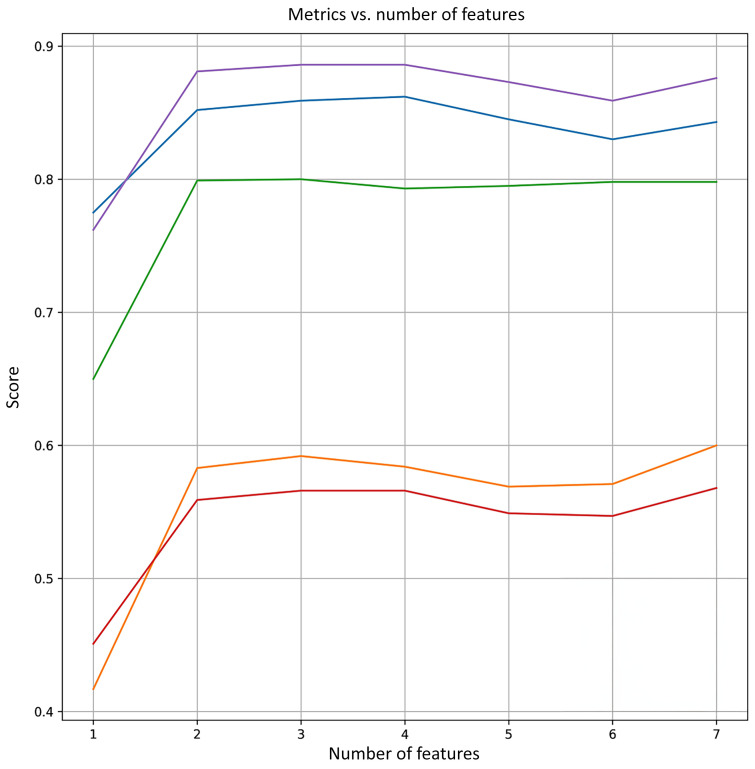
Figure 7. Variation of metrics based on number of features.
Visual representation of metrics (specificity, sensitivity, AUC, NPV, and PPV) based on the addition of features according to their importance as determined by Shapley analysis. Purple line, PPV; blue line, specificity; green line, ROC; orange line, sensitivity; red line, NPV.

