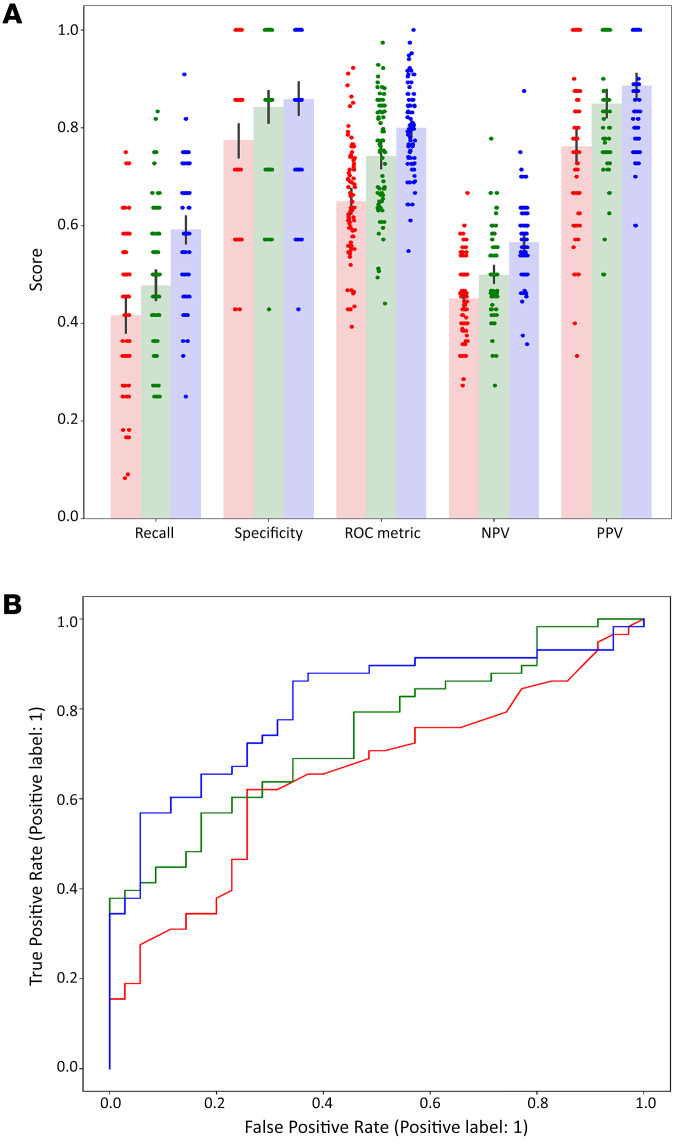
Figure 8. Repeated 5-fold cross-validation results on the best feature set.
(A) Bar plot of metrics for solely clinical laboratory features (red, ALT), solely cfDNA features (green, cfDNA ng/mL, and cfMonocytes) and combined (blue, ALT, cfDNA ng/mL, and cfMonocytes) (B) ROC curves for solely clinical laboratory features (red, ALT; AUC = 0.65), solely cfDNA features (green, cfDNA ng/mL, and cfMonocytes; AUC = 0.74) and combined (blue, ALT, cfDNA ng/mL, and cfMonocytes; AUC = 0.81). cf, cell free DNA; cfDNA ng/mL=cell free total DNA levels in ng/mL.

