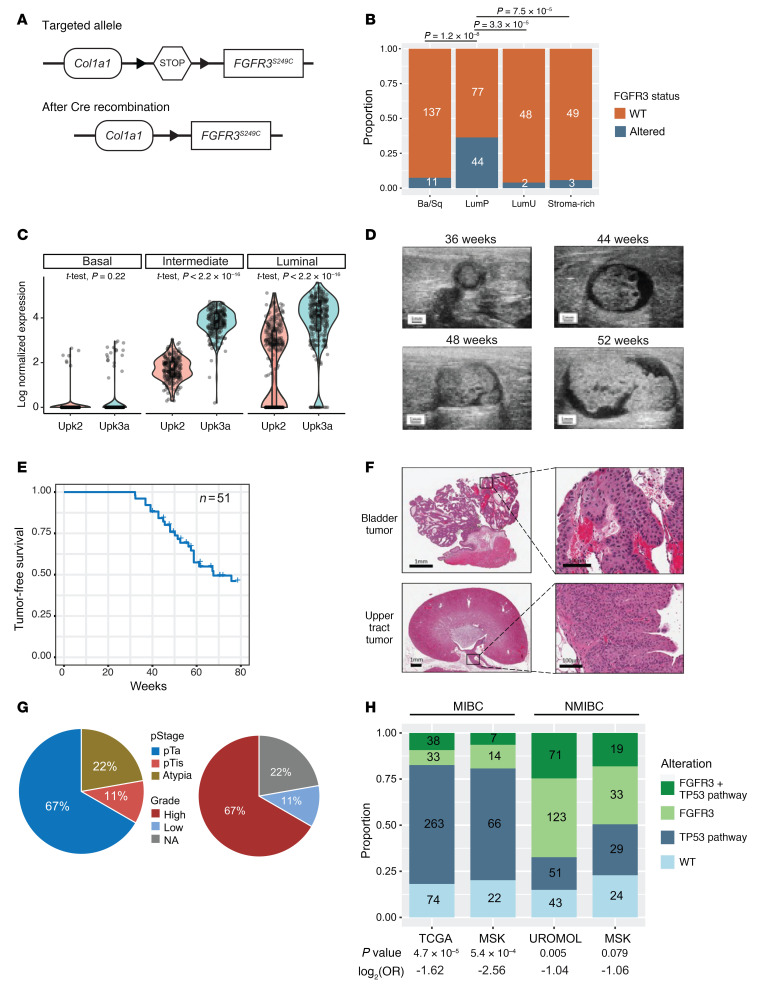
Figure 1. UPFL mice develop papillary, high-grade, non–muscle-invasive bladder cancers.
(A) Schematic of the targeted and recombined Col1a1-LSL-FGFR3S249C locus. (B) Proportion of TCGA-BLCA project tumors within each consensus molecular subtype with FGFR3 mutations. Inset numbers annotate actual patient numbers. (C) Violin plots of log2-normalized Upk2 and Upk3a RNA expression in basal, intermediate, and luminal cells of mouse urothelium. Two-sided t test–derived P values were calculated between Upk2 and Upk3a within each cell type. Tumor-free survival and tumor growth were monitored by ultrasound imaging. (D) Representative serial ultrasound images of the bladder in a UPFL mouse, demonstrating bladder tumor growth (n = 51). (E) Kaplan-Meier curve of tumor-free survival of 51 total mice. (F) Photomicrographs of a bladder tumor and an upper tract urothelial carcinoma (UTUC) of the proximal ureter. Scale bars: 1 mm (left) and 100 μm (right). (G) Percentage of tumors of indicated pathologic T stage and grade (n = 9). (H) Stacked bar plots representing the co-occurrence of FGFR3 and p53 pathway alterations (TP53, ATM, RB1, MDM2, E2F3, ATR) within MIBC (TCGA and MSK [2014]) and NMIBC (UROMOL and MSK [2017]). Two-sided Fisher’s exact test was performed to calculate significance and log2-transformed odds ratios were generated to determine association, with log2(OR) < 0 indicating mutual exclusivity.

