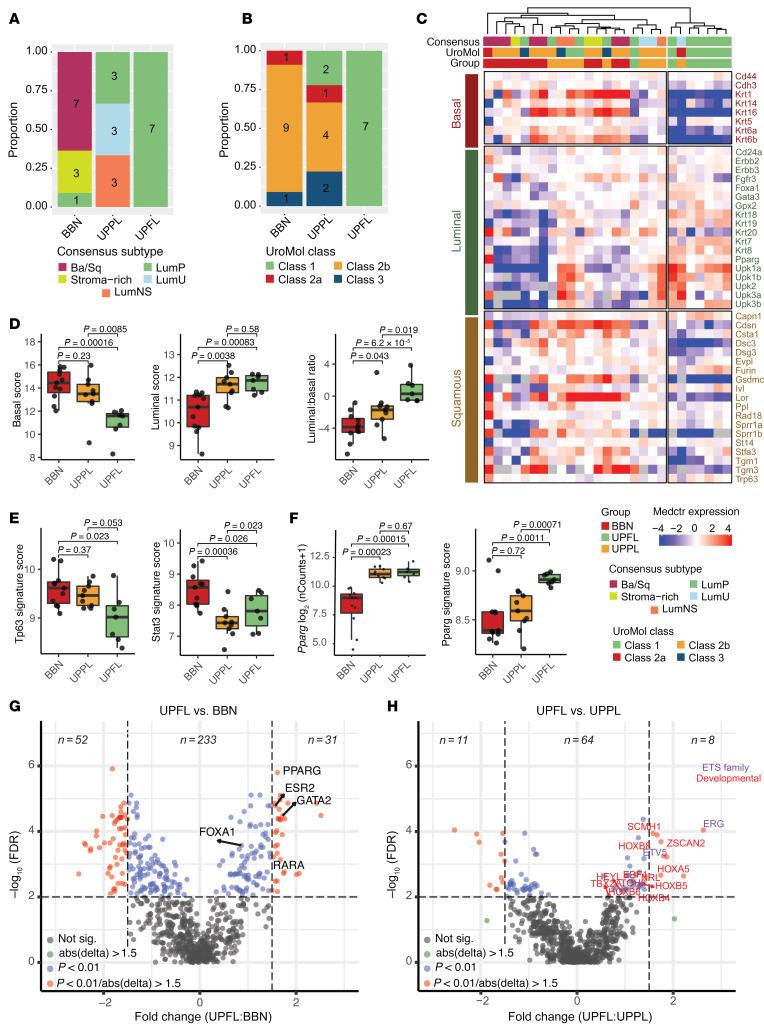
Figure 2. UPFL tumors are associated with luminal expression patterns.
(A) Proportion of BBN, UPPL, and UPFL primary tumors of the indicated RNA consensus MIBC molecular subtype. (B) Proportion of BBN, UPPL, and UPFL primary tumors of the indicated RNA UROMOL NMIBC molecular subtype. (C) Heatmap of unsupervised clustering of BBN, UPPL, and UPFL primary tumors by canonical basal and luminal genes. (D) Box-and-whisker plots of normalized expression of basal and luminal score as well as luminal to basal score ratio of BBN, UPPL, and UPFL primary tumors. (E) Box-and-whisker plots of normalized expression of Krt6a and Upk1a of BBN, UPPL, and UPFL primary tumors. (F) Box-and-whisker plots of PPARG and PPARG gene signature (17, 25) of BBN, UPPL, and UPFL primary tumors. All box-and-whisker plots show the IQR and midline at the median. Error bars represent Q1/Q3 ± (1.5 × IQR). Two-sided t tests followed by Bonferroni’s correction to account for multiple comparisons were performed; the P values are shown above the given comparison. (G) Volcano plot of regulon activity between UPFL versus BBN primary tumors. (H) Volcano plot of regulon activity between UPFL versus UPPL primary tumors. The x axis represents the log2(fold change) between UPFL and BBN (G) or UPPL (H) and the y axis is the Benjamini-Hochberg false discovery rate for the given gene.

