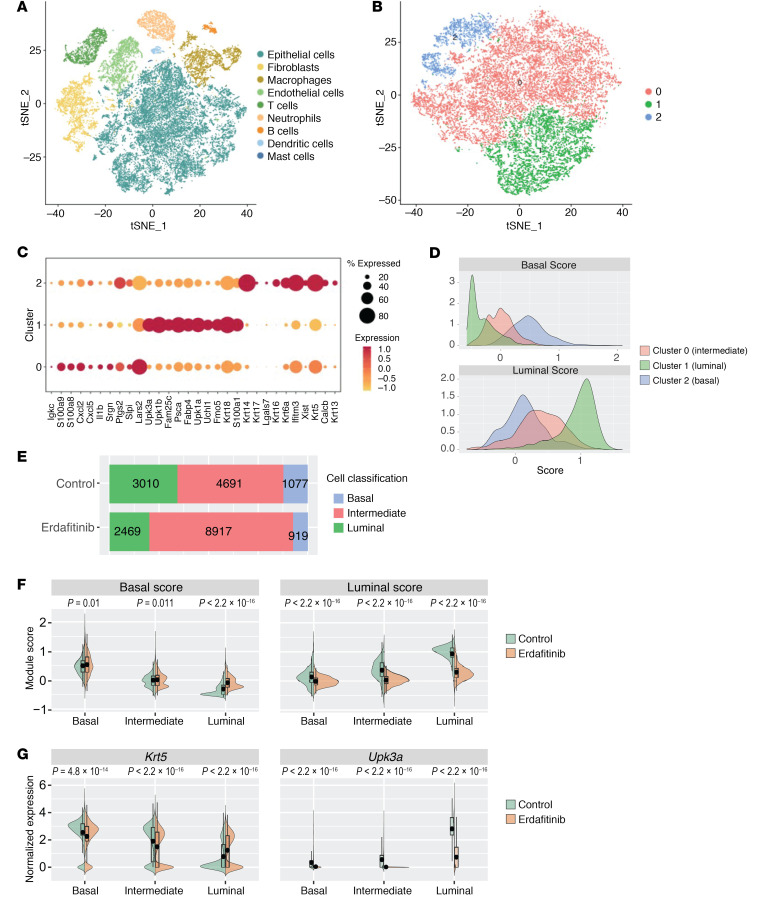
Figure 3. FGFR3 promotes a luminal expression pattern and suppresses the basal transcriptional program across all urothelial cell types, but most prominently in luminal cells.
(A) tSNE plot of scRNA-seq data of combined control (n = 2) and erdafitinib-treated (n = 2) tumors. (B) tSNE plot of scRNA-seq data of epithelial cells of combined control (n = 2) and erdafitinib-treated (n = 2) tumors clustered on basal and luminal genes, demonstrating 3 clusters. (C) Percentage and level of RNA expression of differentially expressed genes across the indicated clusters. (D) Histograms of basal and luminal scores of the indicated clusters from B. (E) Proportion of epithelial cell type (basal, intermediate, luminal) of control or erdafitinib-treated tumors demonstrates expansion of intermediate cells in erdafitinib-treated tumors. (F) Back-to-back violin plots of basal and luminal scores by cell type (basal, intermediate, luminal). (G) Back-to-back violin plots of Krt5 and Upk3a RNA expression by cell type (basal, intermediate, luminal). Two-sided t tests were performed, with the P values shown above the given comparison.

