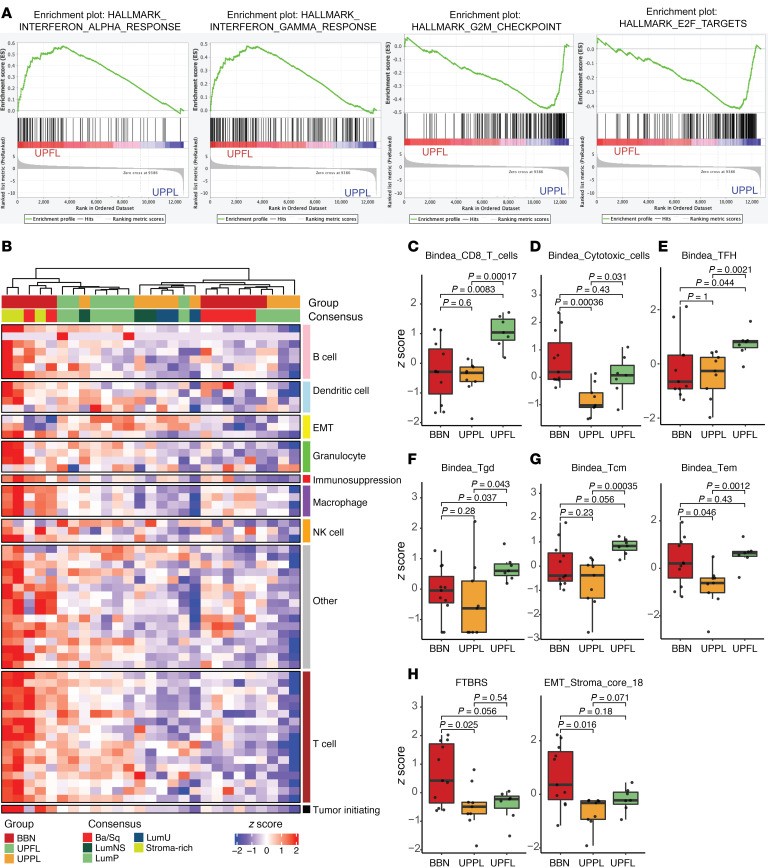
Figure 4. UPFL tumors have an intermediate T cell–inflamed immune contexture.
(A) GSEA plots of the indicated gene signatures. (B) Heatmap of unsupervised clustering of BBN, UPPL, and UPFL primary tumors by a panel of immune gene signatures. Box-and-whisker plots of the indicated immune gene signatures of BBN, UPPL, and UPFL primary tumors: (C) CD8+ T cells, (D) cytotoxic cells, (E) T follicular helper cells (TFH), (F) γδ T cells (Tgd), (G) central memory (Tcm) and effector memory T cells (Tem), and (H) fibroblast TGF-β response (FTBRS) and EMT Stroma signature. All box-and-whisker plots show the IQR and midline at the median. Error bars represent Q1/Q3 ± (1.5 × IQR). Two-sided t tests followed by Bonferroni’s correction to account for multiple comparisons were performed, with the P values shown above the given comparison.

