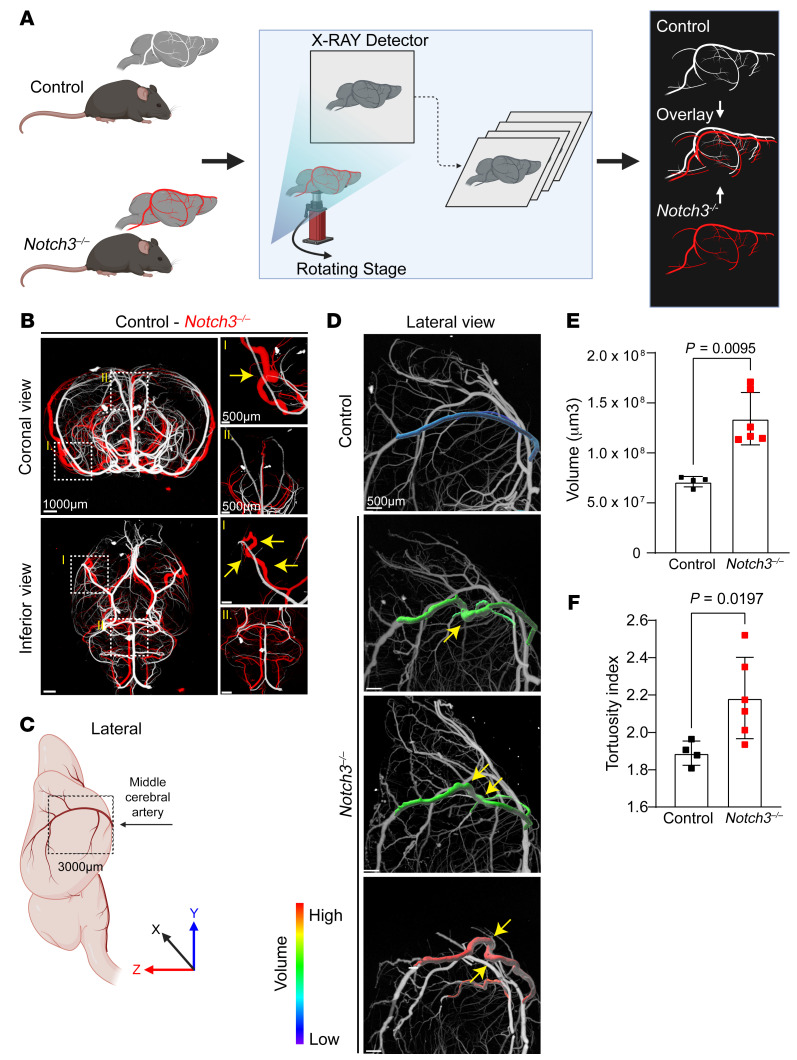
Figure 3. Notch3 deficiency leads to vascular dilation and tortuosity in the middle cerebral artery.
(A) Schema of experimental analysis whereby micro-CT overlay of the brain vasculature of Notch3–/– (red) and control (white) mice identifies abnormalities. (B) Coronal and inferior micro-CT overlay of Notch3–/– and control animals at 18 months. Yellow arrows indicate tortuosity and aneurysms in Notch3–/– compared with control. Scale bars: 1000 μm (left), 500 μm (right). (C) Schema of the regions of middle cerebral artery (MCA) measured in D. (D) Volumetric analysis of the MCA from the circle of Willis to 3,000 μm in Z axis (from the MCA branch point upward) in control and Notch3–/–. Maximum-intensity projections of MCA were color-coded by volume and overlaid on the base micro-CT visualization (white) in the lateral view. Yellow arrows indicate tortuosity. Scale bars: 500 μm. (E) Quantification of MCA volumes from Notch3–/– and control littermates at 18 months. n = 4–6; Mann-Whitney test. (F) Quantification of tortuosity index for the MCA in a cohort of control and Notch3–/– animals. n = 4–6; Welch’s t test.

