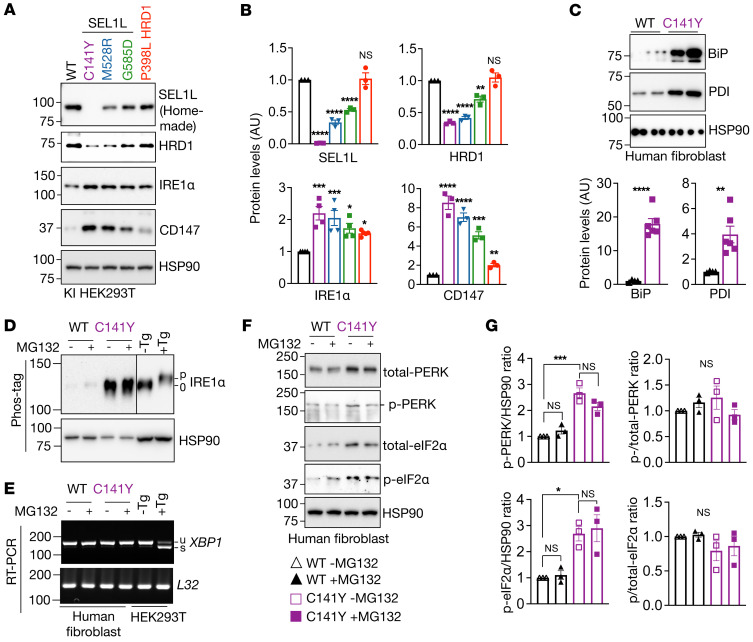
Figure 4. SEL1LC141Y causes severe ERAD dysfunction, but not an overt UPR.
(A and B) Western blot analysis of SEL1L, HRD1, and endogenous ERAD substrates in various KI HEK293T cells expressing different variants, with quantitation shown (B) (n = 3–4 per group). (C) Western blot analysis of ER chaperones in WT and SEL1LC141Y patient fibroblasts with quantitation shown below (n = 4–6 per group). (D) Western blot analysis of IRE1α phosphorylation using Phos-tag gel in WT and SEL1LC141Y patient fibroblasts treated with and without 10 μM MG132 for 2 hours (n = 3 per group). Tg, thapsigargin, ER stress inducer. (E) Reverse transcription PCR (RT-PCR) of XBP1 splicing levels in WT and SEL1LC141Y patient fibroblasts treated with and without 10 μM MG132 for 2 hours. Two independent repeats. u, unsplicing; s, splicing. (F and G) Western blot analysis of PERK and eIF2α phosphorylation in WT and SEL1LC141Y patient fibroblasts treated with and without 10 μM MG132 for 2 hours, with quantitation shown (G) (n = 3 per group). p, phosphorylation. n, individual cell samples. Data are represented as means ± SEM. *P < 0.05; **P < 0.01; ***P < 0.001; ****P < 0.0001, 2-tailed Student’s t test (B, CD147 protein level comparison between WT and P398L cells; C); 1-way ANOVA followed by Tukey’s post hoc test (B, comparison between WT and other variants; G).

