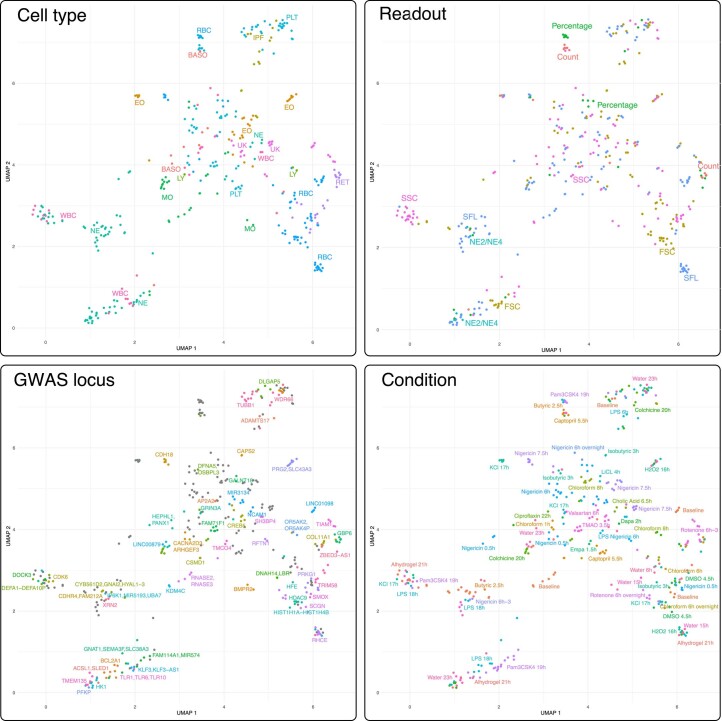
Extended Data Fig. 3. Blood readouts with significant genetic associations form clusters based on cell type, readout, perturbation condition and associated genetic loci.
Distance correlations between all pairs of blood trait readouts with significant genetic associations were projected into a 2-dimensional embedding using UMAP. Each trait is assigned a color by the cell type, the type of readout, associated candidate genes at the GWAS locus and the perturbation condition.

