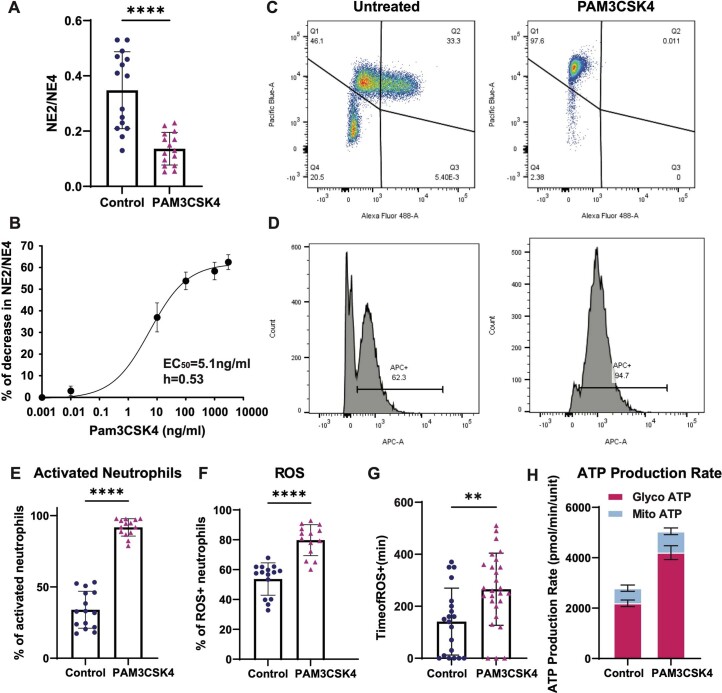
Extended Data Fig. 4. Neutrophil response to TLR1/TLR2 ligand Pam3CSK4.
a, NE2/NE4 ratio from Sysmex readout at 17 h in blood incubated with Pam3CSK4, compared to control. n = 15 donors’ blood samples were examined. Error bars indicate s.d. b, Dose-dependent effect of Pam3CSK4 on NE2/NE4 ratio at 17 h post incubation. n = 9 donors’ blood samples were tested. c, Flow cytometry analysis of isolated neutrophils stained with Alexa 488 conjugated CD62L and Pacific blue conjugated CD11b under untreated and Pam3 conditions. d, Histogram of CellRox in neutrophils isolated from blood with or without Pam3CSK4 treatment. e, Percentage of neutrophil activation under control (n = 15 donors’ blood samples) or Pam3CSK4 conditions (n = 14 donors’ blood samples). Error bars indicate s.d. f, Percentage of ROS+ neutrophils under control (n = 15 donors’ blood samples) and Pam3CSK4 (n = 14 donors’ blood samples) conditions. Error bars indicate s.d. g, Time of neutrophils stay ROS positive under control (n = 20 neutrophils from 3 donors) and Pam3CSK4 (n = 27 neutrophils from 3 donors) conditions. Error bars indicate s.d. h, Seahorse analysis of isolated neutrophils showing ATP produced from the mitochondria and the anaerobic glycolysis pathways in conditions of control and PAM3CSK4 treated. Five replicates were performed for the same donor. Error bars shown indicate s.e.m. of measurements from four donors’ blood samples. Paired two-sided t-test was used to determine statistical significance in a, e, and f. Unpaired two-sided t-test was used in g. **P < 0.01, and ****P < 0.0001.

