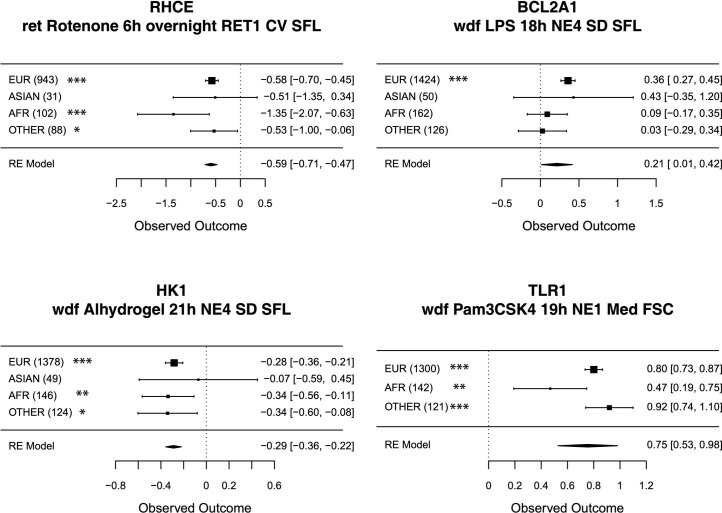
Extended Data Fig. 6. Genetic associations for selected traits across different ancestry groups.
Forest plots of ancestry-specific associations for selected lead SNPs. Each plot shows estimated log HR and 95% CI across distinct ancestry groups after harmonizing the effect allele. Genotype counts are shown in parentheses. Asterisks next to each ancestry group denote levels of significance reached: *P < 0.05, **P < 0.01, ***P < 0.001. The size of the squares represents the weight of each study in the meta-analysis. The diamond at the bottom of each forest plot represents the combined effect size and its confidence interval from the multi-ancestry meta-analysis. The SNPs shown are rs644592 (RHCE), rs67760360 (BCL2A1), rs6480404 (HK1) and rs5743618 (TLR1).

