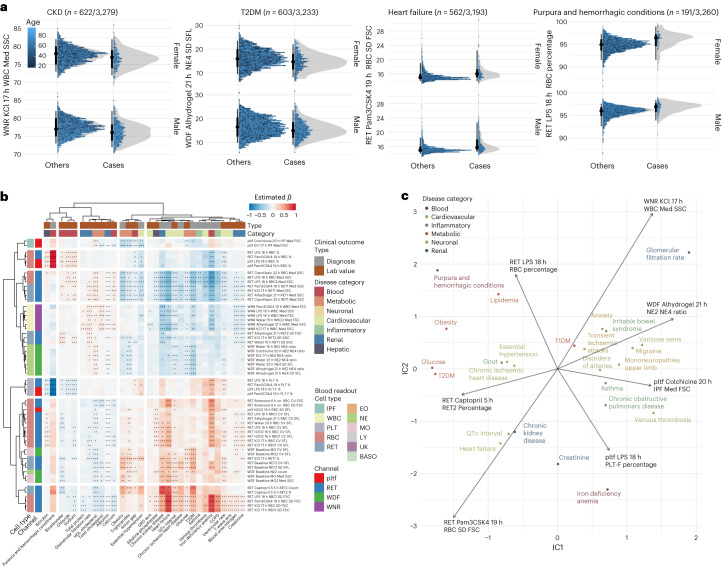
Fig. 3. Blood readouts under perturbation conditions are associated with clinical traits.
a, Distribution of raw blood readouts with associated clinical diagnoses. Each point shows readout for one study participant, stratified by sex and disease status, with color indicating age at blood draw. The gray area illustrates the normalized density of readouts for each subgroup. b, Pairwise association between quantile-transformed blood readouts and clinical lab values or diagnostic codes. Association effect sizes were estimated using linear and logistic regression models for quantitative lab measurements and binary traits, respectively. Positive associations are shown in red; negative associations are shown in blue. Only associations for a subset of blood traits are shown (see Supplementary Fig. 2 for all blood traits that have significant genetic associations). P values were adjusted for FDR to account for multiple testing across 327 perturbational blood readouts and 50 clinical outcomes, including 20 lab values and 30 diagnoses. Points indicate significant associations with adjusted P value thresholds as follows: one point signifies 0.001, two points signify 0.001 and three points signify 0.0001 (see Supplementary Table 4 for clinical trait definitions using diagnostic codes and Supplementary Data 2 for all association results with FDR < 0.1). c, ICA of the t score matrix of associations between blood readouts and clinical endpoints. Shown is a subset of diagnoses and lab values projected onto the first two independent components together with mixing matrix loadings of selected blood readouts. FDR, false discovery rate; ICA, independent component analysis; T2DM, type 2 diabetes mellitus; T1DM, type 1 diabetes mellitus.

