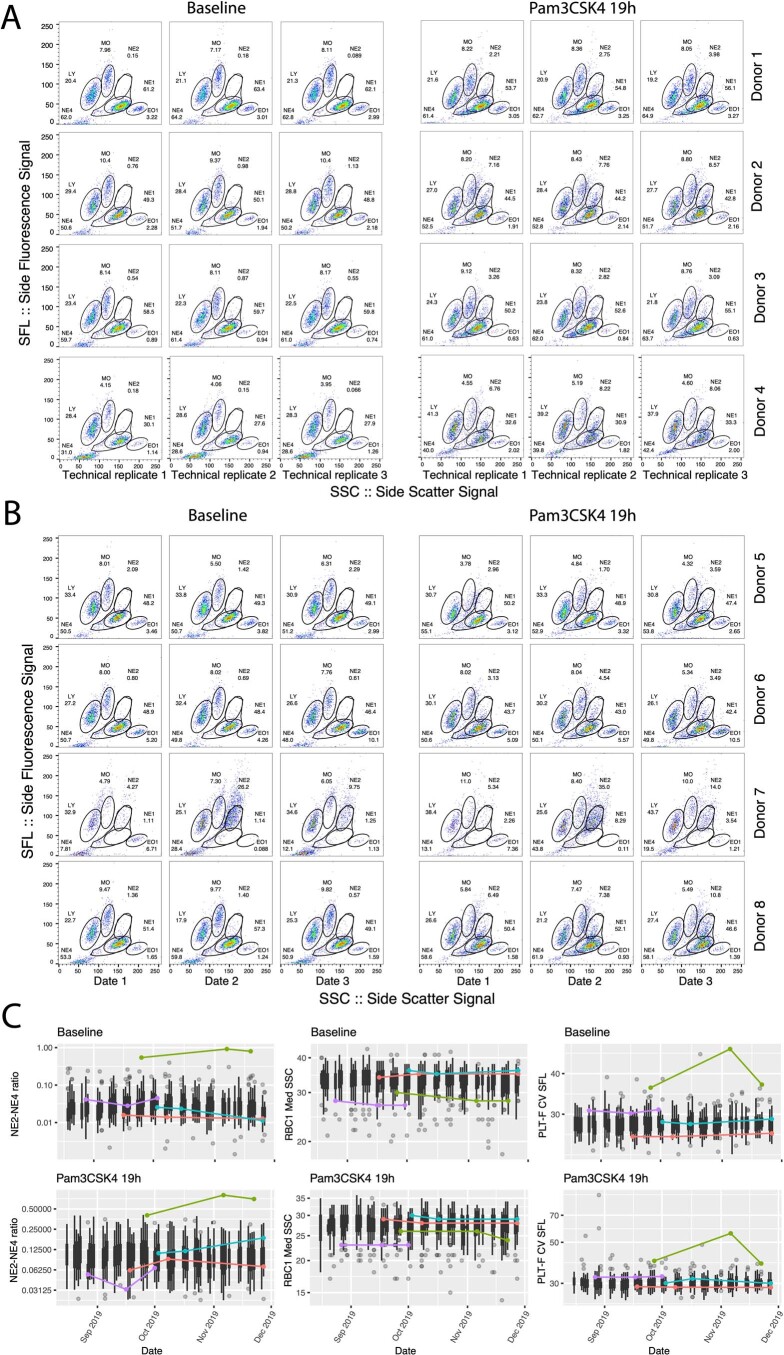
Extended Data Fig. 2. Blood cell distribution and gates in WDF Channel for technical replicates from the same blood draw and measurements from the same individuals over time.
a, Examples of blood cell distributions in the WDF channel for three technical replicates of four randomly selected donors under baseline and Pam3CSK4 19 h conditions. Replicates were performed on samples collected from the same blood draw. b, Examples of blood cell distributions in the WDF channel for three longitudinal replicates of four randomly selected donors under baseline and Pam3CSK4 19 h conditions. Replicates were performed on the same donor from samples collected at different time points that are months apart. c, Examples of three blood traits calculated from our flow cytometry gates (NE2/NE4 ratio, RBC1 Med SSC, and PLT-F CV SFL) under baseline and Pam3CSK4 19 h conditions for data collected over the course of four months. The black dots shown indicate all study participants. The time-dependent trajectories of four donors (same individuals as shown in b) were plotted in colors. Boxplots for daily measurements represent the interquartile range (IQR) between the first and third quartiles as the box, the median as the line inside the box, and the whiskers extend from the box to the largest and smallest values within 1.5× IQR, with any points outside of this range shown as individual outliers.

