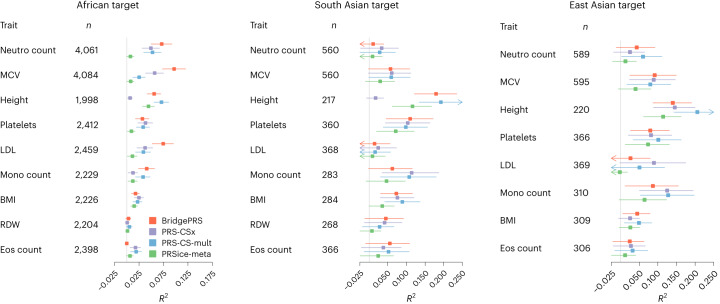
Fig. 4. Predictive accuracy of quantitative traits in BioMe samples.
For each trait, variance explained (R2), point estimates and 95% confidence intervals for BridgePRS, PRS-CSx, PRS-CS-mult and PRSice-meta are shown for African, South Asian and East Asian ancestry samples. Confidence intervals were calculated by bootstrapping using 10,000 replicates20,21. n, sample size; Neutro count, neutrophil count; MCV, mean corpuscular volume; Platelets, platelet count; Mono count, monocyte count; BMI, body mass index; RDW, red blood cell distribution width; Eos count, eosinophil count.

