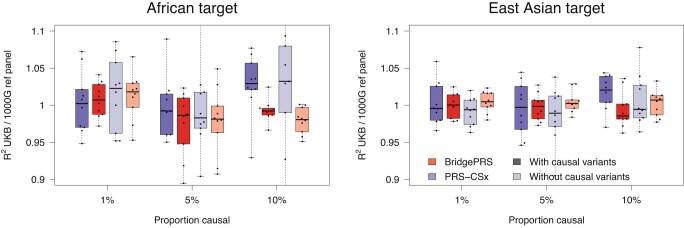
Extended Data Fig. 4. Ratio of phenotypic variance explained R2 using UK Biobank and 1000 Genomes LD reference panels in simulations.
Results are shown for BridgePRS and PRS-CSx across six simulation scenarios, 10 simulated phenotypes per scenario with h2=0.25 for African and East Asian ancestry samples. Data was simulated using 1000 Genomes as reference. Under each set of analyses the proportion of causal variants and the relative power of the data used is shown, measured by nh2/m up to proportionality, where n is the GWAS sample size, h2 heritability and m the number of causal variants. The central rectangular boxes show the interquartile range, horizontal lines inside the boxes show the median, whiskers extend to the most extreme results and points show results for each of the 10 simulated phenotypes.

