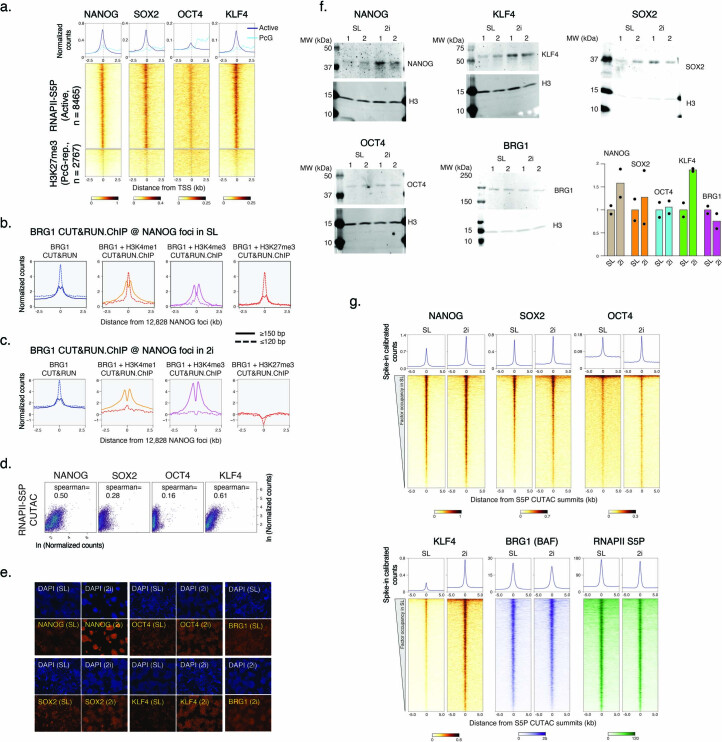
Extended Data Fig. 5. CUT&RUN of pluripotency TFs in SL versus 2i culture conditions.
a, Heatmaps (bottom) and average plots (top) comparing pluripotency TF occupancy by CUT&RUN at RNAPII-enriched (active) and H3K27me3-enriched (PRC2-repressed) promoters. Promoters were grouped based on K-means clustering of RNAPII-S5P and H3K27me3 CUT&Tag reads mapping to a 5 kb window around the TSSs of RefSeq-annotated mESC genes, see Extended Data Fig. 4a. b, c, Enrichment of nucleosomal (≥150 bp, solid lines) and subnucleosomal (≤120 bp, broken lines) reads from BRG1 CUT&RUN and CUT&RUN.ChIP experiments, relative NANOG foci (smallest fragment within primary peaks called in SL condition), in SL (b) and 2i (c) mESC culture conditions. CUT&RUN.ChIP data were plotted as enrichment in histone ChIP over IgG isotype control. d, Scatterplots comparing pluripotency TF CUT&RUN and RNAPII-S5P CUT&Tag reads over S5P CUTAC peaks in SL mESCs. e, Immunofluorescent staining comparing pluripotency TF and BRG1 expression in SL versus 2i culture conditions. Cy5-conjugated secondary antibodies were used in all experiment except for KLF4, where Rhodamine red-conjugated antibody was used. DAPI (blue) was used to stain the nucleus in cells. f, Western blot analysis comparing pluripotency TF and BRG1 expression in SL and 2i culture conditions. Equal amounts of extracted total proteins were loaded in each well of 4–20% gradient polyacrylamide SDS electrophoresis gel, and histone H3 signal is used as control to ensure equivalent protein loading. Bar-graph quantifications represent average of two biological replicates with individual data points shown as black dots. Data were normalized to values in SL. g, Heatmaps (bottom) and average plots (top) comparing pluripotency TF occupancy by spike-in calibrated CUT&RUN in SL versus 2i culture conditions. Heatmaps were plotted relative to S5P CUTAC summits showing TF binding at sites of DNA accessibility and sorted by decreasing TF occupancy in SL (CUT&RUN signal). All datasets are representative of at least two biological replicates.

