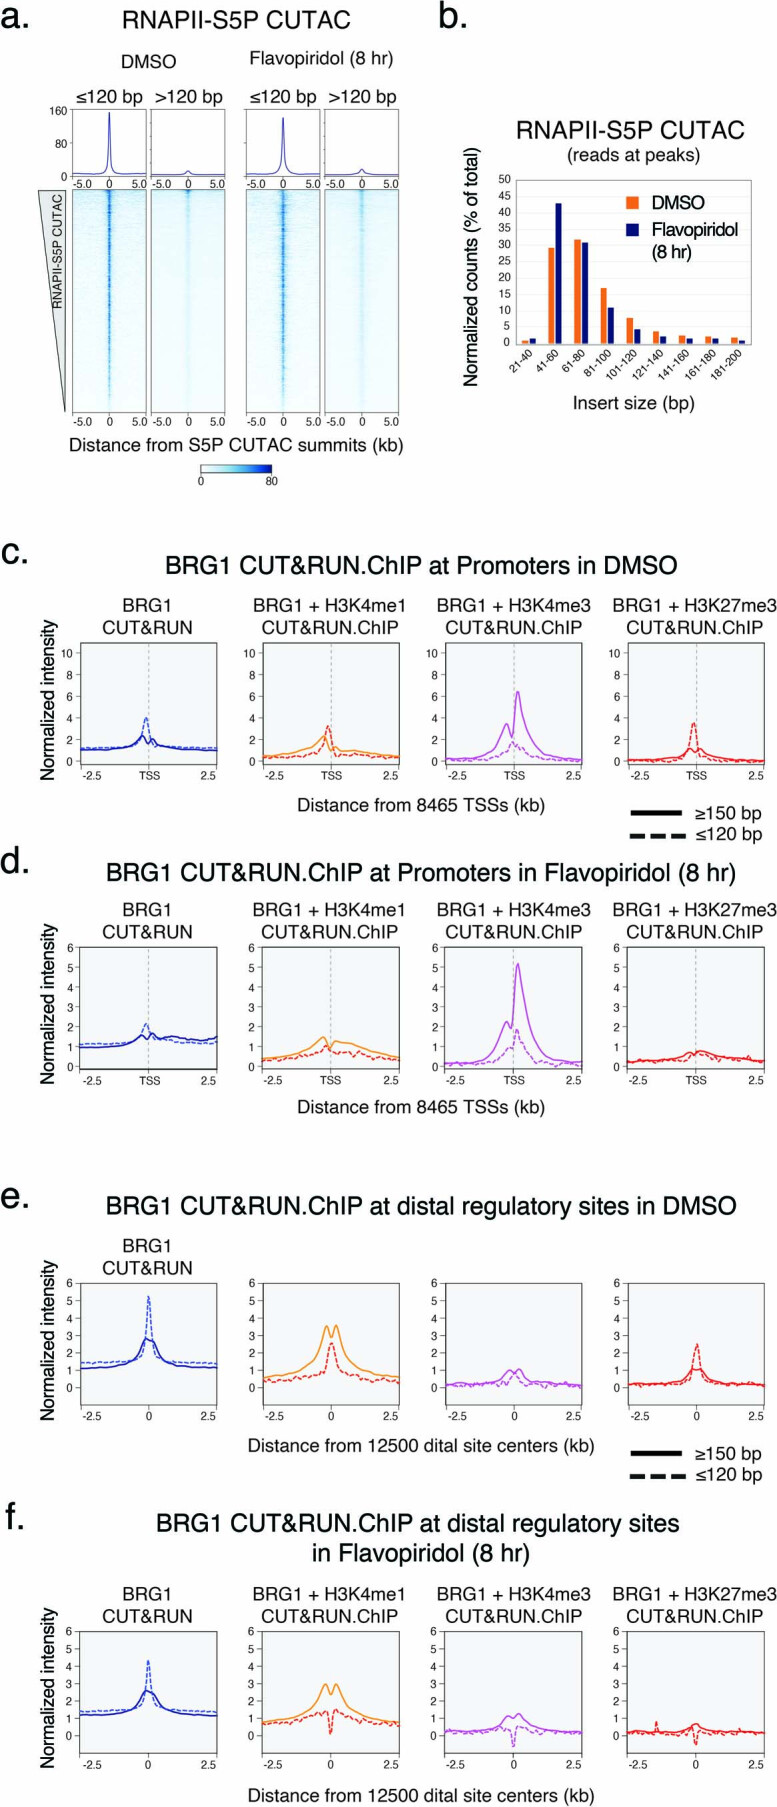
Extended Data Fig. 3. CUT&RUN.ChIP of BRG1.

a, Heatmaps (bottom) and average plots (top) of RNAPII-S5P CUTAC separated by fragment size, relative to primary peaks (summits) of RNAPII-S5P CUTAC. b, Comparison of RNAPII-S5P CUTAC fragment size distribution over peaks (promoter and enhancer NDR spaces) in cells treated with DMSO (control) and Flavopiridol; same data as used for Fig. 2A, plotted differently. c-f, Enrichment of nucleosomal (≥150 bp, solid lines) and subnucleosomal (≤120 bp, broken lines) reads from BRG1 CUT&RUN and CUT&RUN.ChIP experiments, relative to gene promoter TSSs showing RNAPII-S5P enrichment (c, d) and distal regulatory sites (e, f), in DMSO (c, e) and Flavopiridol (d, f) treated cells. CUT&RUN.ChIP data were plotted as enrichment in histone ChIP over IgG isotype control. All datasets are representative of at least two biological replicates.
