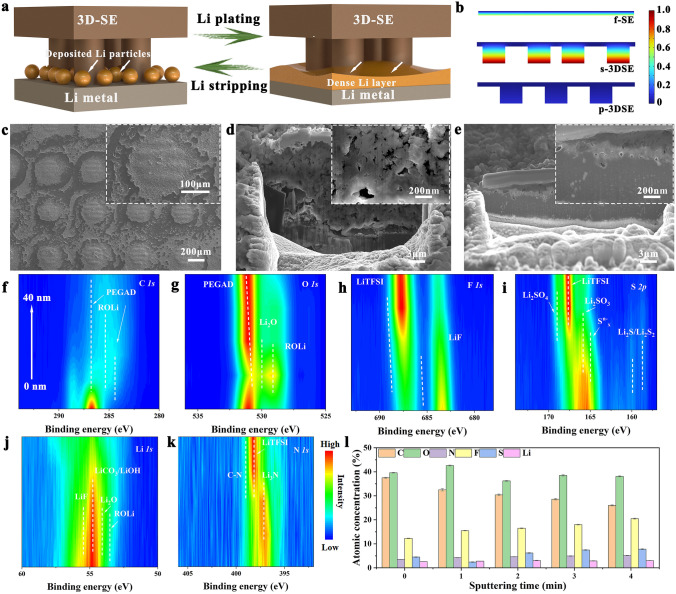
Fig. 6.
a Schematic illustration of the plating process of Li metal with the p-3DSE. b Li+ concentration distribution ascends along the Li anodes interface and three-type electrolytes based on simulation. SEM images of c p-3DSE after cycles from top-view, Li metal cycled beyond 1000 times under d f-SE electrolyte and e p-3DSE electrolyte after FIB cutting from cross-sectional view (Insets are enlarged SEM images). Sputter-down XPS spectra of f C 1s, g O 1s, h F 1s, i S 1s, j Li 1s, and k N 1s spectra of p-3DSE interfaces. l Bar charts showing the atomic concentrations of different sputtering times in the electrolyte interface

