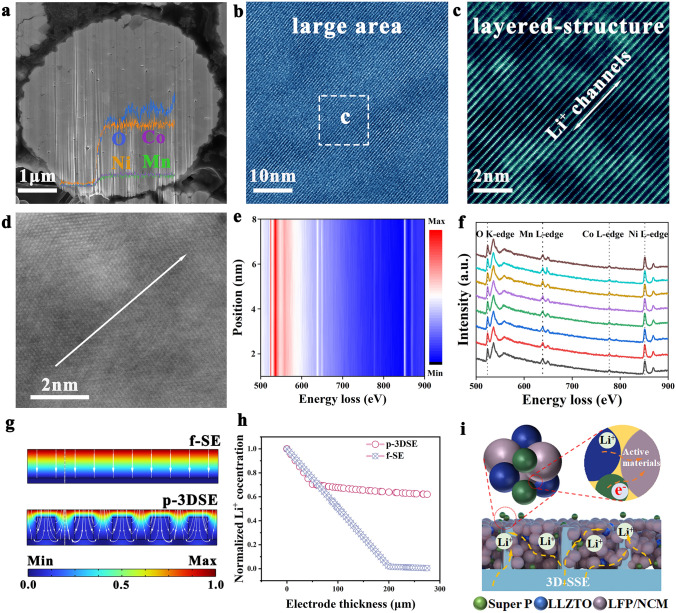
Fig. 7.
a Cross-sectional image of FIB-SEM and line-scan of O, Ni, Co, and Mn elements of NCM811 cathode after cycles with p-3DSE. b, c HAADF-STEM images of the interior region for FIB-prepared NCM811. d–f High-resolution STEM image, and the corresponding EELS spectra of Co, Ni, Mn L-edge, and O K-edge. g Li+ concentration distribution of the integrated electrolyte/cathode at 200 μm for f-SE and p-3DSE electrolytes, and h the corresponding relationship between Li+ concentration and electrode thickness along the vertical direction (the line in Fig. 7 g). i Schematic illustration of the Li+ transport mechanism between p-3DSE and cathode materials

